UK Gilt Bond Market Looks Vulnerable At These Better Levels
Interest-Rates / UK Interest Rates Jun 19, 2009 - 06:45 AM GMTBy: Seven_Days_Ahead
 The Technical Trader’s view:
 |
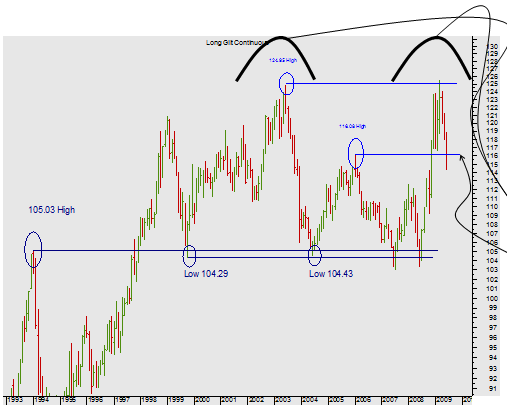
MONTHLY CONT. CHART Like other bond markets, the Gilts are tempting the bears with the possibility of a Top. The Double failure at 125 is very bearish. But the initial pull-back from the highs at 125 has found support at the Prior High at 116.08. But will that hold? |
 |
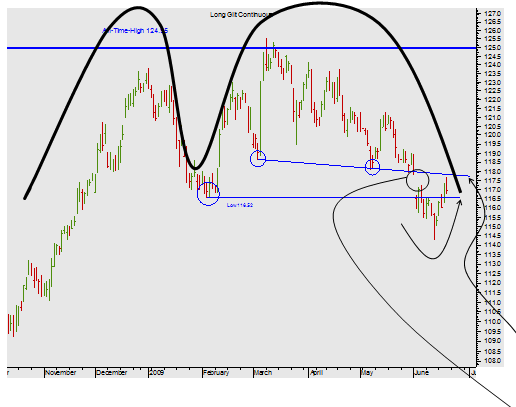
DAILY Cont. CHART [Daily continuation charts are needed in the absence of substantial price action in the front month contract.] Note the interesting completion of a large Double Top (surely?) and then the retracement of the market recently back through the completion level at 116.52. But only as far as the falling diagonal from the lows at 117.80 currently. The Gap may yet be covered (requiring a trade to 117.77) but it may not. And a new failure and descent back down through the 116.52 low would set the seat on a renewed and confirmed bear market. Now look closely at the Sep 09 chart. |
 |
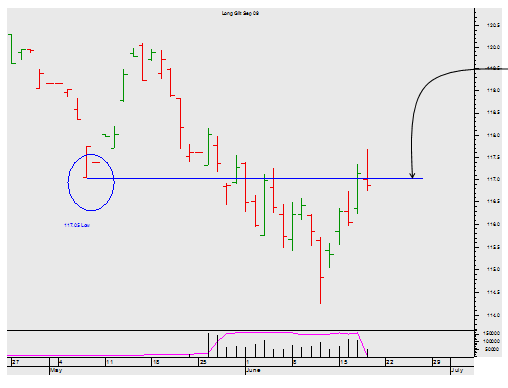
DAILY SEP 09 CHART This too looks like a failure at a prior Low – entirely consistent with a solid bear trend. Bears should wait for a confirmed close beneath that 117.05 level before selling. |
The Macro Trader’s view:
The Gilt has rallied hard over recent days as traders have begun to doubt the strength of early signs of recovery in the UK economy. Only last week, traders were confident that several weeks of improving data was evidence the UK recession was coming to an end and an early return to growth was imminent.
With a substantial fiscal and monetary stimulus in place, traders we had been concerned the authorities wouldn’t act fast enough to neutralize this in order to prevent a fresh outbreak of inflation, which together with the worst peace time public finances on record, could have led to a vicious bear market in the Gilt.
The evidence for the growth optimism was clear:
- Two months of better than expected PMI Services surveys which now predict a return to growth in the service sector,
- Both the Nationwide and HBOS released house price surveys showing prices had increased month on month,
- The RICS housing market survey has improved significantly over recent months, and
- The NIESR GDP estimate looks set to predict either flat or a small positive for Q2 GDP.
Other data has supported the recovery scenario too, especially the improvement in mortgage approvals.
But recently, sentiment in the US has turned mildly negative due to doubts that business spending will be sufficient to support recovery. Also, several key Euro zone data releases have shown the Euro zone economy is further away from recovery than previously thought. And with today’s UK retail sales report showing greater weakness than expected, traders are temporarily ignoring the stronger domestic UK data and reacting to international indicators and the Gilt is enjoying a recovery.
Yet the bear market in the Gilt can hardly be over. UK Government debt ratios are set to hit levels not seen since the First World war and if traders now doubt the strength of recovery, which we do not, those debt levels will only worsen.
Moreover, forecasts of CPI inflation falling to below 1.0% and close to zero have so far proved incorrect; CPI released on Tuesday, was worse than expected and rose from 2.0% to 2.2% year on year.
This makes it more likely than not that the current price action in the Gilt is only a correction. Traders hate out-of-control government borrowing and they also hate rising inflation. When the two are mixed it is usually a lethal cocktail.
If it were only the UK that was set to issue unprecedented levels of debt over the next several years, one could almost accept that the market could absorb it, albeit at slightly higher yields. But with all the major economies, especially the US with a $1.8T deficit in the same predicament, markets are only going to absorb the mountain of new debt at increasingly higher bond yields, and we judge the Bear market in the Gilt is only in its early stages.
Philip Allwright
By Mark Sturdy
Seven Days Ahead
Be sure to sign up for and receive these articles automatically at Market Updates
Mark Sturdy, John Lewis & Philip Allwright, write exclusively for Seven Days Ahead a regulated financial advisor selling professional-level technical and macro analysis and high-performing trade recommendations with detailed risk control for banks, hedge funds, and expert private investors around the world. Check out our subscriptions.
© 2009 Copyright Seven Days Ahead - All Rights Reserved
Disclaimer: The above is a matter of opinion provided for general information purposes only and is not intended as investment advice. Information and analysis above are derived from sources and utilising methods believed to be reliable, but we cannot accept responsibility for any losses you may incur as a result of this analysis. Individuals should consult with their personal financial advisors.
© 2005-2022 http://www.MarketOracle.co.uk - The Market Oracle is a FREE Daily Financial Markets Analysis & Forecasting online publication.


