Stock Market S&P 500 Valuation With Normalized Earnings
Stock-Markets / Stock Market Valuations Jun 15, 2009 - 07:58 AM GMTBy: Richard_Shaw
 There are many institutional S&P 500 forecasts in the media for 2009, generally ranging from 850 to 1100 with some outliers on each side, but seldom is the underlying detail provided. One of the more common methods of estimation involves normalization of earnings times a reasonable multiple based on history.
This article will attempt to back into some of the leading institutional projections using normalized earnings and historically experienced multiples.
Key Historical Index Price Levels:
The S&P stands now at 946. It had a low of 741 last November and 666 in March. The high in 2007 was approximately 1575. The low in 2002-2003 was approximately 770.
Institutional Estimates:
We cataloged a number of institutional forecasts in a recent article. The forecasts here come from that article plus a few newer ones. Estimate publication dates range from early May through now (issued within approximately a month).
Goldman this week stated an expectation of 950 to 1050 for 2009
Marc Faber predicts a possible run up to 1000 to 1050 by July with a near-term retracement that will not go below 800.
Meryl Witmer thinks the market is just about right now. Archie McAllaster thinks the market is cheap at its current level.
Alan Abelson, editor of Barron’s, thinks the valuation is too high, and like Fred Hickey believes a selloff is in the offing, because the fundamentals don’t support the price level.
Deutche Bank predicts 1060 by year-end, while JP Morgan Chase is close to that predicting 1100 for 2009.
Morgan Stanley sees not much value above 825 to 850.
Barclay’s (older estimate from April 17) predicted 757 for 2009 year-end.
HSBC forecasts 900 for year-end 2009
We recollect reading some noted analyst predicting 1200 to 1250, but can’t remember who. Let’s toss it is just to keep the range fairly wide.
Normalized Earnings.
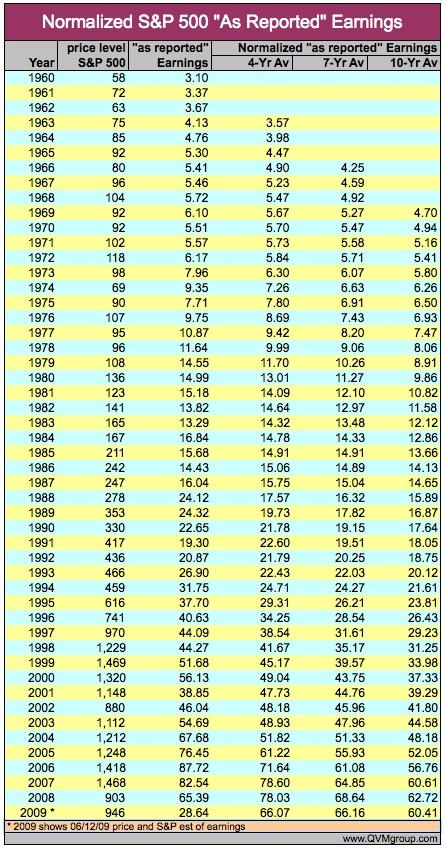
Here is a table that presents S&P 500 “as reported” earnings (including 2009 projected “as reported” earnings from Standard and Poor’s) for 50 years (from 1960 through 2009), along with the year-end S&P 500 index price (current price shown for 2009).
The earnings are normalized (averaged without inflation factor) for 4 years, 7 years and 10 years. The rationale for the periods is: 4 years as a presidential cycle, 10 years as a very long time, and 7 years as in between.
We end up with normalized earnings of $60 to $66 (2009 alone at about $29).
Note that the current Goldman Sachs estimate for 2009 is $63 — right in the middle of our normalized earnings (but we don’t know if Goldman was speaking of “as reported” or operating earnings).

Historical P/E Ranges:
Based on the numbers in the table, we see an average P/E over the 50 years from 17.4 to 20.6 times “as reported” earnings for 4 to 10 year normalization, with a minimum ranging from 8.7 to 11.0, and a maximum ranging from 32.5 to 43.2.
We take the position that we are past the worst of the crisis for a while at least, and that we are far from being in a normal (average) situation. Therefore, it might be reasonable and justifiable to assign a multiple to the normalized earnings somewhere between the minimum and average values.
Without trying to split hairs over whether we are closer to bad or closer to average, if we simply use the mid-point between average and minimum multiples, we get roughly 13 for the four-year normalization, 14.5 for the seven-year normalization and 16 for the ten-year normalization.
S&P Price Forecast With Normalization and Historical P/E:
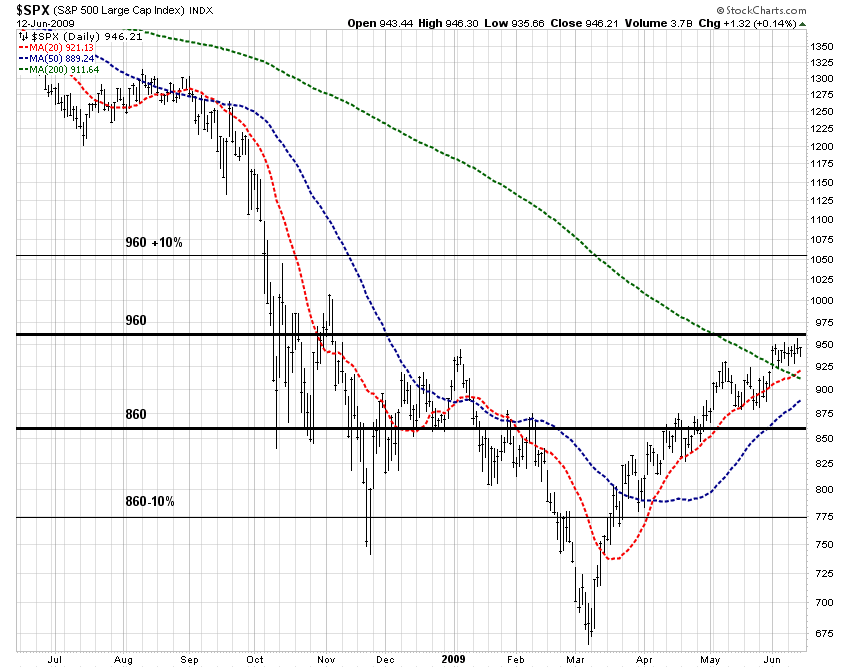
The mechanical process we have just gone through yields predicted values of approximately 860 to 960 for the S&P as a “fair value” now. That is plus 1.5% to minus 9.1%.
A straight average valuation, which we feel is unjustified, would render fair value of 1150 to 1250.
Normalization would tend to suggest that there is more downward logic than upward logic. Current sentiment and government spin on the economy, plus nervous cash on the sidelines, may suggest more upside than downside.
In any event, we see 775 to 1060 as the most likely range within which the S&P 500 will move in the near future, barring any new shocks to the system. That range is the 860-960 plus 10% overshoot on the high side and minus 10% overshoot on the low side. This widened range represents the current market plus 12.1% and minus 18.1%.
Proxy SPY, with a 1/10th of index corresponding price range, would come out at about 78 to 106. The current price is $95. It would have the same +1.5% to -9.1% (or +12.1% to -18.1%) price range forecast for the year as the index it tracks.
Charting the Results:
This chart of the S&P 500 shows a plot of the index with two bold black horizontal lines bounding the 860 to 960 “forecast”, and two thin black horizontal lines bounding a 10% error factor in each direction.

The result of this mechanical approach produces a spread of forecasts that approximates the spread of forecasts of the several institutional analysts.
We’re not sure whether or not that is comforting about their work, but that’s how the numbers look, and is probably similar to at least one of the methods used in developing the forecasts that are reported to us in the media.
Because the markets are irrational short-term and rational long-term, wide variance from these estimates is entirely possible. Because so much is up in the air about US government intervention in the market process, the rules could be rewritten overnight which put all forecasts into a cocked hat.
As an investor, you’ve got to try to read and lead the market, and chose when to play and when to stay; but you also have to protect and conserve assets when your play is wrong. We think protective stops on risk positions make sense in this uncertain financial environment.
By Richard Shaw
http://www.qvmgroup.com
Richard Shaw leads the QVM team as President of QVM Group. Richard has extensive investment industry experience including serving on the board of directors of two large investment management companies, including Aberdeen Asset Management (listed London Stock Exchange) and as a charter investor and director of Lending Tree ( download short professional profile ). He provides portfolio design and management services to individual and corporate clients. He also edits the QVM investment blog. His writings are generally republished by SeekingAlpha and Reuters and are linked to sites such as Kiplinger and Yahoo Finance and other sites. He is a 1970 graduate of Dartmouth College.
Copyright 2006-2009 by QVM Group LLC All rights reserved.
Disclaimer: The above is a matter of opinion and is not intended as investment advice. Information and analysis above are derived from sources and utilizing methods believed reliable, but we cannot accept responsibility for any trading losses you may incur as a result of this analysis. Do your own due diligence.
Richard Shaw Archive |
© 2005-2022 http://www.MarketOracle.co.uk - The Market Oracle is a FREE Daily Financial Markets Analysis & Forecasting online publication.


