The Precious Metal and Energy Trading Report
Commodities / Gold & Silver 2009 Jun 15, 2009 - 02:06 AM GMTBy: Chris_Vermeulen
 We continued to see precious metals under pressure last week. The US dollar moved firmly higher on Friday which sent gold & silver plummeting lower. Oil continued to drift to new multi month highs while natural gas moved sideways.
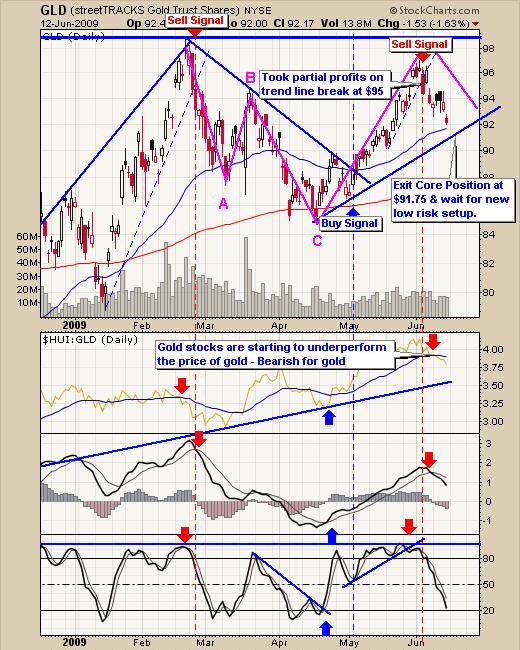
Gold – GLD Fund – Daily Chart
The GLD fund has been drifting lower towards my support trend line the past two weeks. I figure we will have some action as we wait for a bounce off support or a break down through the blue support trend line. Looks like we are a few weeks away from any possible setup in gold/GLD.
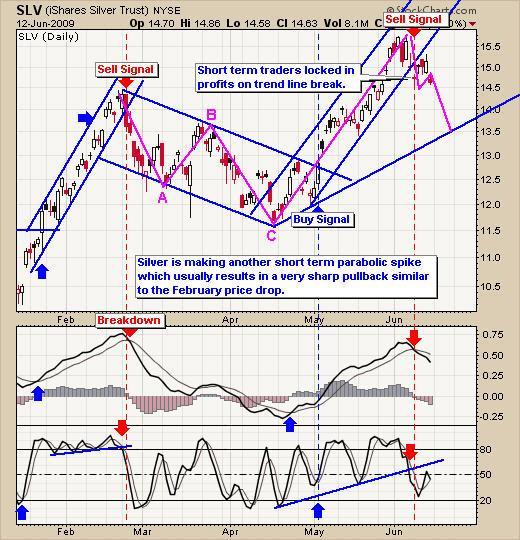
Silver – SLV Fund – Daily Chart
The Silver SLV fund has been moving lower in a controlled manor. We could see prices pull back to the $13.50 level this week. It looks like we are weeks away from any possible setup is silver as too.
Energy Sector – Crude Oil & Nat Gas
I have put together three charts to show you what I think is very possible in the near term for Nat Gas prices. The USO (oil fund) and the UNG (Nat Gas fund) have similar price movements. In short these funds move with the price of their underlying commodity (oil or gas). Because these funds must purchase futures contracts which allows the fund to move with underlying commodity there are some issues with price performance. The funds are affected buy Contango (search “What is USO contango” for more info). In simple terms it means the price of the fund loses value over time and does not track the exact same price performance as the underlying commodity.
These funds must purchase futures contracts and because of the popularity of these two funds they are now large enough to move the commodity price when rotating from one future contract to the next on a regular basis. This helps boost the price of the commodity when the fund rolls over to the next futures contract.
That being said we are now seeing the same issues and price pattern we saw in USO happening in the Natural Gas Fund UNG. Check out the charts below.
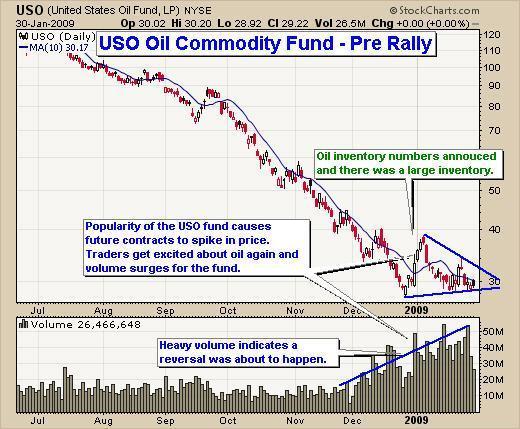
USO Oil Fund – Before the Rally – January Chart
The USO fund started to become very popular back in January and volume surged to new highs. This was an early indicator that the trend was getting close to reversing. The increase in demand for this fund became so large that it was actually moving the price of oil as it rolled from one futures contract to the next.
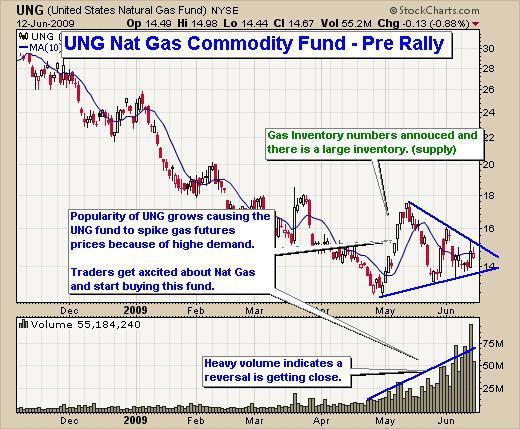
UNG Nat Gas Fund – Current Price (Before the Rally J )
By simple looking at this chart of gas and the USO oil chart above you will see the similarities. Demand for the commodity fund is incredibly high indicating a change in trend is getting close. This increase in UNG demand forces the fund to buy more Nat Gas futures contracts and the price of gas becomes much more volatile when the fund buys the new futures contract.
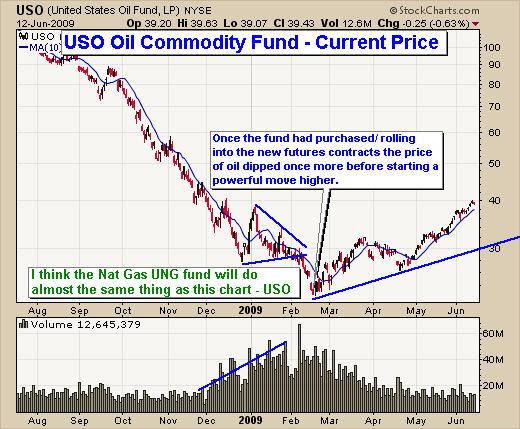
It is important to notice what USO (oil) did after this surge of volume and price pattern was broken. This is provided on the next chart of USO.
USO Oil Fund – The Rally – Current Chart
The price of USO dipped one last time breaking down from its pennant sending price sharply lower only to reverse the following week which was the start of this powerful rally we have been enjoying for several months now. I expect we will see something like this happen with the UNG fund as well.
Gold, Silver, Oil and Nat Gas Trading Conclusion:
Stepping back and taking a simple glance at these commodities we are able to tell if we should be taking action or sitting back and waiting for some low risk/high probability setups.
I do like each of these commodities and investment vehicles for short term trading. But I must resist buying them because I like them and stick with my plan to only enter a position when I have a low risk/high probability setup available.
It is easy to create a trading strategy/plan but following it is a completely different story. Once you can follow your strategy, then you’re ahead of 95% of other traders. I will admit, I’m really excited about this UNG setup which looks to be forming, but I am not jumping in and buying it yet. I follow my trading strategy/rules very closely and because of my strict rules and 3% risk style it’s some times painful waiting for an entry. But I have mastered the way I trade and my yearly goal is to have 10-25 trades yielding 2-10% profit each.
Hello, I'm Chris Vermeulen founder of TheGoldAndOilGuy and NOW is YOUR Opportunity to start trading GOLD, SILVER & OIL for BIG PROFITS. Let me help you get started.
If you would like more information on my trading model or to receive my Free Weekly Trading Reports - Click Here
I have put together a Recession Special package for yearly subscribers which is if you join for a year ($299) I will send you $300 FREE in gas, merchandise or grocery vouchers FREE which work with all gas stations, all grocery stores and over 100 different retail outlets in USA & Canada.
If you have any questions please feel free to send me an email. My passion is to help others and for us all to make money together with little down side risk.
To Your Financial Success,
By Chris Vermeulen
Chris@TheGoldAndOilGuy.com
Please visit my website for more information. http://www.TheGoldAndOilGuy.com
Chris Vermeulen is Founder of the popular trading site TheGoldAndOilGuy.com. There he shares his highly successful, low-risk trading method. For 6 years Chris has been a leader in teaching others to skillfully trade in gold, oil, and silver in both bull and bear markets. Subscribers to his service depend on Chris' uniquely consistent investment opportunities that carry exceptionally low risk and high return.
This article is intended solely for information purposes. The opinions are those of the author only. Please conduct further research and consult your financial advisor before making any investment/trading decision. No responsibility can be accepted for losses that may result as a consequence of trading on the basis of this analysis.
Chris Vermeulen Archive |
© 2005-2022 http://www.MarketOracle.co.uk - The Market Oracle is a FREE Daily Financial Markets Analysis & Forecasting online publication.


