How to Make Money on the Summer Stocks & Commodities Rally
Stock-Markets / Investing 2009 Jun 12, 2009 - 10:09 AM GMTBy: Uncommon_Wisdom
 Sean Brodrick writes: These are not normal markets — take what you know about how the market moves on fundamentals and throw them out the window, where they will probably drown in a flood of government money.
The government is spending so much money that, according to USA Today, taxpayers are on the hook for an extra $55,000 a household to cover rising federal commitments made just in the past year. That’s a rise of $6.8 trillion in new obligations in 2008 alone!
Yes, those debts will come due, and then there could be hell to pay. In the meantime, let’s look at what the government has bought us — all the ingredients for a sizzling summer rally.
Here are three signs that the market has higher to go, and this rally could last for some time …
Sign #1: The Bottom Is Falling Out of the Bond Market

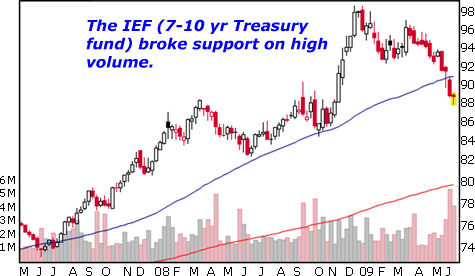
See this updated live at: http://stockcharts.com/h-sc/ui?s=IEF&p=W&b=5&g=0&id=p97978855999&a=170158252
Let’s not even talk about long-term bonds, and China’s sudden allergy to them. Let’s talk about the 7-10 year bond U.S. Treasuries market.
The middle part of the Treasury curve started rallying in mid-2007 when our financial system and economy hit the skids. During times of stress, investors seek safety, and we’re always told there is nothing safer than a U.S. Treasury bond.
However, this market started selling off in May, when the stock market started to rally. Indeed, riskier assets like stocks, high-grade corporate bonds and even junk bonds are all rallying. This tells us that investors are reallocating money into riskier assets.
Interestingly, President Obama’s budget calls for yields on the 10-year note to rise no higher than 5.25 percent in the next decade. This chart is saying it may not work out that way, and when Obama’s plans hit the rocky shoals of reality, that could throw the market for a loop. But that won’t be anytime soon.
How to play this move: The ProShares UltraShort Barclays 7-10 Year Treasury ETF (PST) aims to track twice the inverse of the move in mid-curve Treasuries.
Sign #2: HPQ Refuses to Die!
Last month, Hewlett-Packard (HPQ) missed badly when it reported second-quarter numbers. EPS tumbled to $0.70 in the latest quarter from $0.80 in the year-earlier period. PC sales dropped 19 percent, printer supplies dropped 23 percent, and the server and storage division dropped 28 percent.
Management’s guidance for upcoming quarters sounded like something written from a hospital burn unit. The stock swooned.
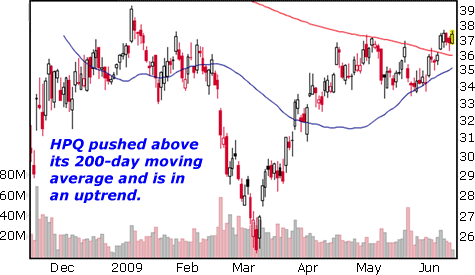
But then June came along. And HPQ rallied right its 200-day moving average. Money is pouring into this stock.

See this updated live at: http://stockcharts.com/..
Importantly, HPQ is a tech bellwether. It is the largest seller worldwide of personal computers, passing Dell’s sales in December.
Also, a large share of HPQ’s business is overseas; therefore, it is more likely than most to catch a rebound in emerging markets.
Because HPQ is a bellwether, it may lead the tech sector higher.
How to play this move: The iShares Dow Jones U.S. Technology Sector Index Fund (IYW) tracks the tech sector, and the ProShares Ultra Technology ETF (ROM) aims to track twice the movement of a basket of tech stocks.
Sign #3: Oil Isn’t the Only Commodity Going Higher
We have seen oil rally recently. Part of this is the anti-dollar trade — if there’s an international currency besides the U.S. dollar it’s oil because everyone uses oil.
The Chinese, even if they stop supporting the U.S. dollar, will still use oil. In fact, if you saw my notes for my Neil Cavuto appearance last week, they’re using a lot of it.
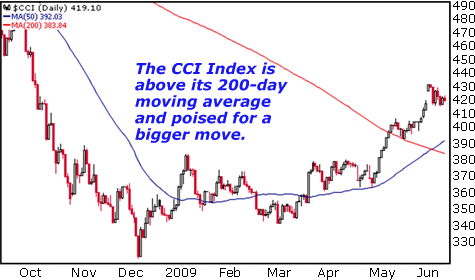
But it’s not just oil that is taking off. Take a look at a chart of the CCI Index. Like the better-known CRB Index, the CCI charts a broad basket of commodities. Unlike the CRB, which is heavily weighted toward energy, the CCI is equally weighted.

See this updated live at: http://stockcharts.com/..
As we can see from the chart, the CCI is breaking out to the upside. It is also above its 200-day moving average, and the 50-day moving average is above the 200-day moving average — an indication that the bullish intermediate trend is overwhelming the bearish longer-term trend.
This is the reflation trade in action. It points to a weaker dollar/higher commodity prices in the intermediate term. This, in turn, should be good for commodity stocks.
How to play this move: The iPath Dow Jones-AIG Commodity Index ETN (DJP) tracks a basket of 19 commodities, 36 percent in agriculture, 30 percent in metals and 34 percent in energy.
The PowerShares DB Commodity Double Long ETN (DYY) adds leverage to juice up to a target of twice the underlying commodity basket’s returns.
So we have a market where bonds are going down, a tech/market bellwether is going higher and commodities are reflating.
Yours for trading profits,
Sean
This investment news is brought to you by Uncommon Wisdom. Uncommon Wisdom is a free daily investment newsletter from Weiss Research analysts offering the latest investing news and financial insights for the stock market, precious metals, natural resources, Asian and South American markets. From time to time, the authors of Uncommon Wisdom also cover other topics they feel can contribute to making you healthy, wealthy and wise. To view archives or subscribe, visit http://www.uncommonwisdomdaily.com.
Uncommon Wisdom Archive |
© 2005-2022 http://www.MarketOracle.co.uk - The Market Oracle is a FREE Daily Financial Markets Analysis & Forecasting online publication.


