


Looks Like a Stocks Bull Market
Stock-Markets / Stocks Bull Market Jun 12, 2009 - 01:18 AM GMTBy: Chris_Ciovacco

 Since humans have been greedy and fearful since the beginning of time, they tend to act in similar ways before, during, and after a financial crisis. These tendencies manifested themselves during the tulip bulb craze of the 1600s, the dot-com craze of the 1990s, and the real estate mania of the 2000s.
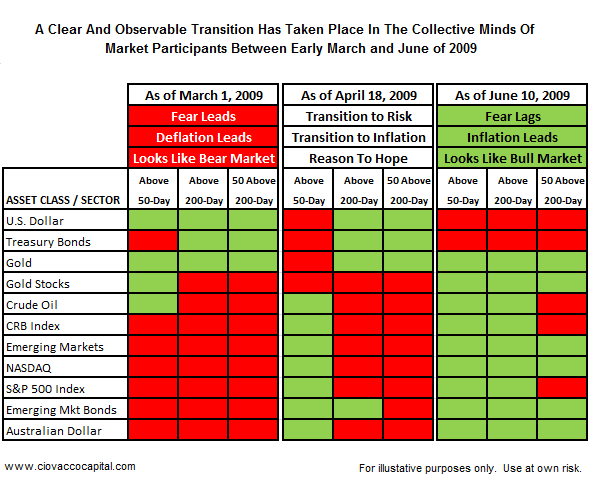
The table shown below allows you to visualize the transition that has taken place between March and June of 2009. In March (far left side of the table), most markets had the characteristics of a bear market. Currently (right side of table), numerous markets look much more like an early bull market than an on-going bear market. Below, we will use the S&P 500 (2000-2004) to illustrate and expand on the concepts as they relate to the current day and the information presented in the table below.
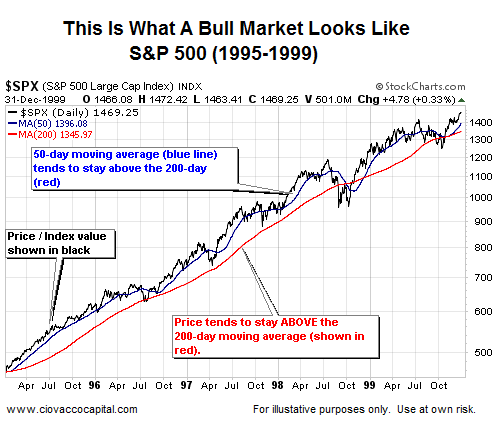
By studying past bull and bear market cycles, we can better understand what to look for during a possible transition form a bear market, dominated by fear, to a bull market which eventually becomes dominated by greed. If we are not aware of the twin thieves, greed and fear, they will rob us and hamper our ability to grow our accounts. As we have stated in the past, in a bull market:
- Price tends to stay above the 200-day moving average(MA) (red line).
- The 50-day moving average (blue line) tends to stay above the 200-day moving average.
In bear markets, professionals tend to buy at extreme points of pessimism looking for a profitable trade. Traders often ride a market back to its 50-day or 200-day moving average and then take profits. In a bear market, traders tend to sell at the 50-day or 200-day because their fear of losses remains greater than their confidence the market can move higher. Their lack of confidence speaks to their pessimistic view of future economic activity. Bear market rallies are mainly fueled by traders and lack participation from longer-term investors.
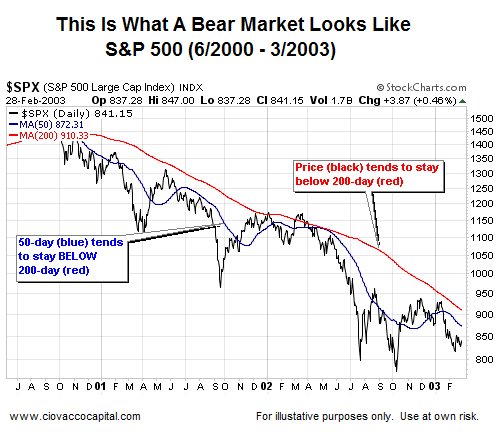
In a bear market (see above), where conviction is lacking to push prices higher:
- Price (black line) tends to stay below the 200-day moving average.
- The 50-day moving average tends to stay below the 200-day moving average.
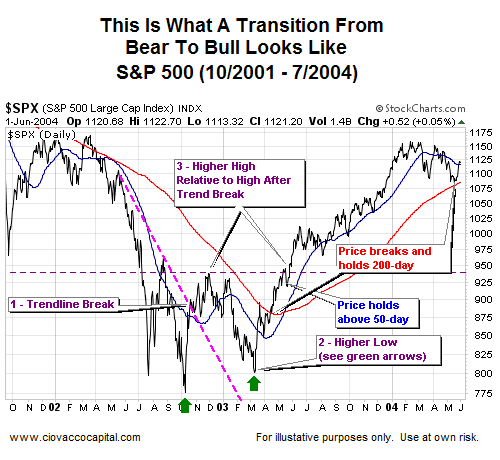
At some point in a bear market, the perception of traders and investors slowly starts to shift toward the acceptance of better times ahead (or "less bad" times). When their confidence, and more importantly their conviction, becomes strong enough, instead of selling at the 50-day or 200-day moving average during a rally, they hold thinking the markets may be able to move higher. If enough investors and traders share the same improved outlook, a market is finally able to clear previously insurmountable hurdles in the form of the 50-day or 200-day moving average.
Emerging Markets Have Lead The Way Higher
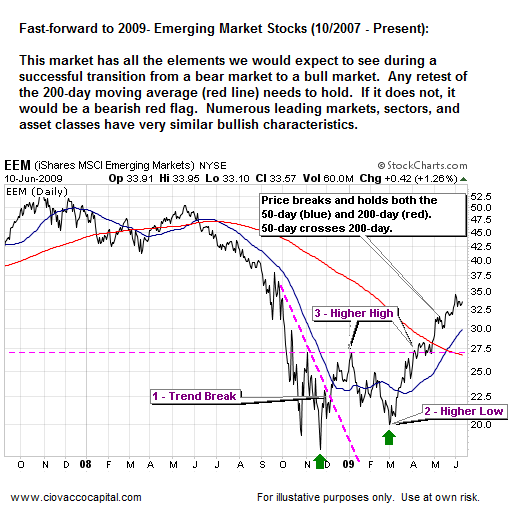
Since the S&P 500 is a laggard in the current market, we will use the Emerging Markets Index to illustrate how numerous leading markets, asset classes, and sectors look in June of 2009. If you compare the chart of the Emerging Markets Index below to the This is What A Transition From A Bear To Bull Looks Like chart above, and do it with an open mind, you will be hard-pressed to come away with a bearish interpretation.
Printed Money And ‘Less Bad’ Economic News In 2009, the basic rationale for driving stock prices higher leans heavily on the “less bad” perception of future economic activity. The markets, as evidenced by credit spreads, commodity prices, and stock prices, have been able to move away from “the end of the world as we know it” mode. An unprecedented amount of economic stimulus and newly printed money has helped shift the primary fear from one of deflation to a possible loss of purchasing power caused by deflation. The market’s perception seems to be “if things get worse economically, and they may, the policymakers’ response will be more stimulus and more printed money”. This perception coupled with the “less bad” outlook has increased the demand for inflation-friendly and weak-dollar assets (oil, gasoline, copper, emerging market stocks, foreign bonds, commodity-related currencies, etc.).
Leading Markets Are Holding Above Their 200-Day MAs
When buyers have enough conviction to push a market above its 200-day moving average during a bear market, they are often immediately greeted by heavy selling. The crossing of a 200-day moving average means little if the market cannot successfully retest and hold it. The longer a market stays above the 200-day MA the more meaningful and bullish it becomes.
Part Of The Pattern: Not Accepting The Possibility Of A New Bull
The fact few are willing to call the current rally anything more than a bear market rally fits well with the historical profile of new bull markets. No one, including us at CCM, can definitively say a new bull market has or has not started – only time and future market action will tell. However, we can confidently state that what has transpired since the March 2009 lows compares very favorably with the end of a bear market and the beginning of a new bull market. How long a new bull might last is also something that can only be definitively answered in retrospect. While market conditions have improved, risk management must remain a significant part of any investor’s game plan. Even bull markets can experience significant corrections.
Check Your Forecast At The Door
Our job is not to agree or disagree with the market’s collective bullish stance. The market does not care what we think and is going to do what it is going to do regardless of any bullish or bearish analysis we can produce. The same can be said for any individual, investment firm, or talking head on TV – the market does not care what they “think”. Our job is to discern as best we can the prevailing risk-reward profile of any given market. The evidence at hand strongly supports a shift from unfavorable conditions for investing to favorable conditions for investing. The purpose is not to forecast, but to understand what is in front of us at the present time while understanding the current bullish evidence may not be in place in a few weeks or months. It is important that we keep an open mind about both bullish and bearish outcomes in order to process future signals from the market with an unbiased mind. This is one reason why we look to minimize bullish and bearish debates with clients – we are human beings and we can become biased just like the next guy. If the markets continue to go up, we want to participate. If the current bullish signals are discounted with obviously bearish action, we will shift our strategy accordingly.Forecasting Can Lead To Defending
As we have stated for years, forecasting can lead to biased interpretations of future market activity. If we tell you this is a bear market rally, we will look for reasons to remain bearish from both a fundamental and technical perspective. Rather than producing and possibly needing to defend a forecast, we simply need to pay attention to what has and is actually happening. If you approach the current market with an open mind, and with a sense of history, it is nearly impossible to ignore the almost countless reasons to accept the possibility a new bull market has started – one that could last longer and go further than most can even imagine. Knowing what we know, it is prudent to continue to deploy capital as long as conditions remain favorable. It is also necessary to respect the numerous fundamental problems that remain and to understand the market’s bullish stance may be relatively short-lived.Fundamentals Are Built Into The Charts
Charts are a way of monitoring the current risk tolerance and collective economic outlook for all market participants. Every bit of fundamental analysis and its impact on investor behavior is built into the charts. Fundamental analysis from the largest brokerage houses and the most successful hedge funds is reflected in the charts. The charts are clearly stating that the collective fundamental outlook has improved greatly in the last 90 days. If the collective economic outlook was not greatly improved relative to prior expectations, numerous asset classes would not have received the conviction from buyers necessary to overtake their 50 and 200-day moving averages. What has happened since the March 2009 lows is most likely not a purely technical event. A purely technical event or a bear market rally from oversold conditions most likely would have failed long ago. If we are willing to listen, the markets are trying to tell us the next 12 to 18 months may not be as bad economically as many believe. The longer the markets can hold above their 200-day moving averages, the more significant the technical and fundamental signals become.
By Chris Ciovacco
Ciovacco Capital Management
Copyright (C) 2009 Ciovacco Capital Management, LLC All Rights Reserved.
Chris Ciovacco is the Chief Investment Officer for Ciovacco Capital Management, LLC. More on the web at www.ciovaccocapital.com
Ciovacco Capital Management, LLC is an independent money management firm based in Atlanta, Georgia. As a registered investment advisor, CCM helps individual investors, large & small; achieve improved investment results via independent research and globally diversified investment portfolios. Since we are a fee-based firm, our only objective is to help you protect and grow your assets. Our long-term, theme-oriented, buy-and-hold approach allows for portfolio rebalancing from time to time to adjust to new opportunities or changing market conditions. When looking at money managers in Atlanta, take a hard look at CCM.
All material presented herein is believed to be reliable but we cannot attest to its accuracy. Investment recommendations may change and readers are urged to check with their investment counselors and tax advisors before making any investment decisions. Opinions expressed in these reports may change without prior notice. This memorandum is based on information available to the public. No representation is made that it is accurate or complete. This memorandum is not an offer to buy or sell or a solicitation of an offer to buy or sell the securities mentioned. The investments discussed or recommended in this report may be unsuitable for investors depending on their specific investment objectives and financial position. Past performance is not necessarily a guide to future performance. The price or value of the investments to which this report relates, either directly or indirectly, may fall or rise against the interest of investors. All prices and yields contained in this report are subject to change without notice. This information is based on hypothetical assumptions and is intended for illustrative purposes only. THERE ARE NO WARRANTIES, EXPRESSED OR IMPLIED, AS TO ACCURACY, COMPLETENESS, OR RESULTS OBTAINED FROM ANY INFORMATION CONTAINED IN THIS ARTICLE. PAST PERFORMANCE DOES NOT GUARANTEE FUTURE RESULTS.
Chris Ciovacco Archive |
© 2005-2022 http://www.MarketOracle.co.uk - The Market Oracle is a FREE Daily Financial Markets Analysis & Forecasting online publication.