


Stock Market Investors Don't be Fooled by NYSE Advancing and Declining Issues
Stock-Markets / Stock Index Trading Jun 10, 2009 - 11:51 AM GMTBy: Marty_Chenard

 Don't be fooled by the number of Advancing and Declining issues every day.
Some investors look at the percentage of issues Advancing and Declining and try to have an opinion about the market's direction. That stops short of getting the full story ... here's why:
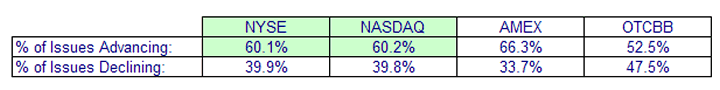
The data for Advancing and Declining issues for yesterday is below.
Notice the number of Advancing Issues on the NYSE and the NASDAQ indexes below. On the surface, it appears as though the NYSE and the NASDAQ exhibited the same exact buying behavior. But did it really?
This next chart shows the data for Advancing and Declining VOLUME.
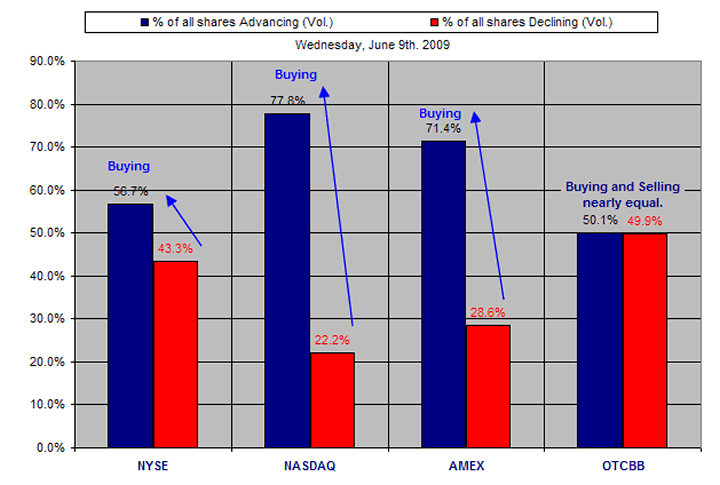
When you now look at the volume behavior on the NYSE and NASDAQ, you can see that the actual story is quite different. Volume has a better correlation with money flow than the number of issues advancing in the market.
So, what is this chart saying?
First, it is showing that the Advancing volume was 77.8% for the NASDAQ and only 56.7% for the NYSE. Since the NYSE and NASDAQ were almost exactly equal on the percentage of issues trading, you would have expected that the Advancing volume would have been about equal as well. But it wasn't.
And since the NYSE had 94% more volume than the NASDAQ yesterday, the differential between the NYSE and NASDAQ volume becomes more relevant.
The NYSE is where "program trading" occurs, and where most of the Institutional investors initiate trades. So, this also indirectly reflects what Institutional investors may be doing.
The conclusion for this story is that the NYSE had almost double the amount of declining volume on a percentage basis over the NASDAQ yesterday. That is not the same "pretty picture" that one gets when they only look at the number of Advancing and Declining issues.
________________________________________________
*** Feel free to share this page with others by using the "Send this Page to a Friend" link below.
By Marty Chenard
http://www.stocktiming.com/
Please Note: We do not issue Buy or Sell timing recommendations on these Free daily update pages . I hope you understand, that in fairness, our Buy/Sell recommendations and advanced market Models are only available to our paid subscribers on a password required basis. Membership information
Marty Chenard is the Author and Teacher of two Seminar Courses on "Advanced Technical Analysis Investing", Mr. Chenard has been investing for over 30 years. In 2001 when the NASDAQ dropped 24.5%, his personal investment performance for the year was a gain of 57.428%. He is an Advanced Stock Market Technical Analyst that has developed his own proprietary analytical tools. As a result, he was out of the market two weeks before the 1987 Crash in the most recent Bear Market he faxed his Members in March 2000 telling them all to SELL. He is an advanced technical analyst and not an investment advisor, nor a securities broker.
Marty Chenard Archive |
© 2005-2022 http://www.MarketOracle.co.uk - The Market Oracle is a FREE Daily Financial Markets Analysis & Forecasting online publication.