Parabolic U.S. Treasury Yield Curve Warning of Hyper Inflation
Interest-Rates / HyperInflation Jun 10, 2009 - 09:45 AM GMTBy: Gary_Dorsch
 Everything depends upon proper judgment. Of ten people who examine the same chart, or listen to the same speech, each person may well understand it differently - perhaps only one of them will understand it correctly. How then should traders interpret the shape of the US Treasury yield curve, which has gone parabolic in recent weeks, steepening to its highest level since 2004? Similarly, in Australia, the Treasury yield curve is at its steepest in history.
Not surprisingly, Federal Reserve officials were quick to provide a few explanations. “In recent weeks, yields on longer-term Treasury securities and fixed-rate mortgages have risen,” said Fed chief Ben “Bubbles” Bernanke on June 3rd. “These increases reflect concerns about large federal deficits, but also greater optimism about the economic outlook, a reversal of flight-to-quality flows, and technical factors related to the hedging of mortgage holdings,” he explained.
As the massive shockwaves to the financial markets from Lehman Brother’s collapse in September have subsided, and the once frozen corporate bond market has thawed-out, - the panic that caused Treasury-bill rates to briefly fall below zero percent for the first time is a fading memory. Fears of another “Great Depression” of the 1930’s have been replaced with cautious optimism over the arrival of “green-shoots,” or signs that the global economy is stabilizing from its free-fall.
Alongside the swift recovery of the global stock markets, the US Treasury yield curve has gone parabolic, and the Fed’s propaganda artists are wringing their hands of any culpability. “I personally don’t believe the rise in long-term bond yields is due to inflation fears,” said Dallas Fed chief Richard Fisher on June 2nd. Rather, “the yield curve’s steepening appears to reflect an improvement in the economic outlook, combined with the Treasury’s huge borrowing needs,” he said.
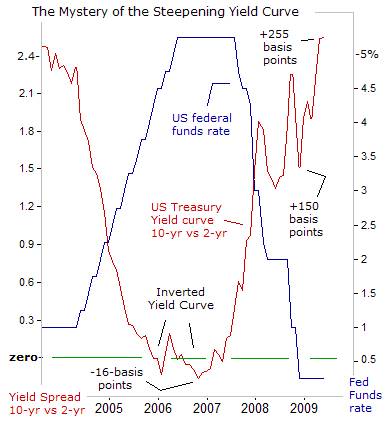 Typically, the Treasury yield curve steepens, when long-term yields are rising faster than shorter-term rates, and the majority of traders are anticipating an economic recovery, to be followed by a tightening of monetary policy. Conversely, the rare appearance of an inverted yield curve, (short-term rates above longer-term yields), has typically materialized near the end of a tightening cycle, and in many cases, telegraphs an economic recession within 12-to-18-months.
The steepening of the US Treasury yield curve is one of the great mysteries in the marketplace today. The US Treasury’s 10-year note is yielding about +254-basis points above the 2-year yield, which is somewhat of an anomaly, since such a wide spread would normally be associated with expectations of a V-shaped recovery for the US-economy. Moreover, the Fed would typically send hints to the markets, that it’s ready to start draining excess liquidity from the money markets, in order to keep inflationary pressures in check.
But on May 24th, Fed deputy Donald Kohn denied the Fed would raise interest rates anytime, arguing that ideas of a V-shaped recovery are far-fetched. “The US-economy is only now beginning to show signs that it might be stabilizing, and the upturn, when it begins, is likely to be gradual amid the balance sheet repair of financial intermediaries and households. As a consequence, it probably will be some time before the Fed begins to raise its target for the federal funds rate.”
However, Kohn’s remarks failed to stop the bleeding in the Treasury bond market, and yields jumped to their highest levels in seven-months. The Fed’s experiment with nuclear “Quantitative Easing,” (QE) is backfiring. The borrowing costs that Bernanke & Company aim to drive lower, are instead, moving higher, despite the Fed’s stated commitment to buy $300-billion of long-term Treasury notes through August, with US-dollars rolling off its electronic printing press.
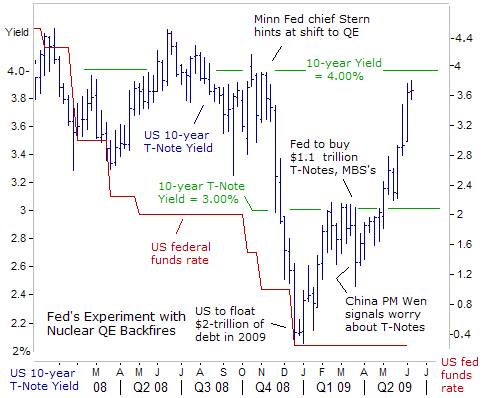
So far, the Fed has bought $150-billion of Treasury debt under the QE framework, but that amount pales in comparison to the $2-trillion supply of new debt that is swamping the credit market this year. This week, the Treasury is auctioning $35-billion in three-year notes, $19-billion in 10-year notes, and $11-billion in 30-year bonds. Given the massive deluge of new supply, the Fed has been unable to manhandle the Treasury market. Its original goal of enforcing a lid on the benchmark 10-year yield at 3.00% has been blown to smithereens.
The Fed tried to follow the blueprints of the Bank of Japan (BoJ), which uses strong-arm tactics in the $8.5-trillion Tokyo bond market, through skillful manipulation and jawboning exercises. Japan’s 10-year bond (JGB) yield has been locked within a tight range between 1.15% and 2.00% for the past ten-years, even through the inflation boom cycle that carried crude oil to $145 per barrel last year.
Now that the Fed is halfway through its money printing binge, it may soon have to decide whether to up the ante, by ramping-up its Treasury debt purchases to as much as $1-trillion. But of course, the big risk with massive QE overdoses is that the gambit could end-up crushing the value of the US-dollar and intensify inflation fears that are festering in the bond market, pushing yields higher. In other words, massive money printing could send crude oil prices to $100 per barrel.
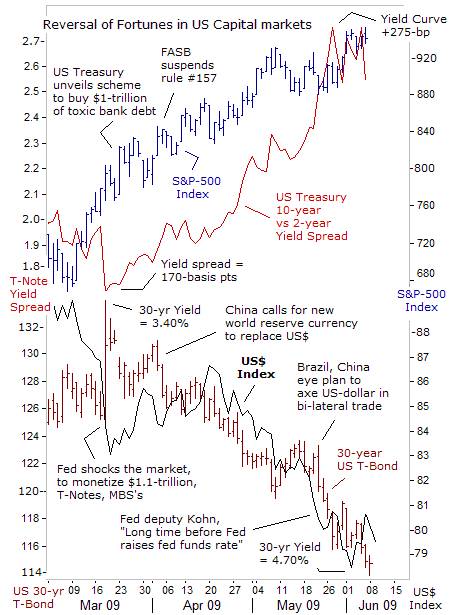
What Fed officials are very worried about privately, but refuse to say publicly, is that “nuclear-QE” could lead to hyper-inflation and foreign flight from American bonds. Less than one-week after the Fed stunned the markets, by saying it would monetize $300-billion of Treasury debt, and $800-billion of mortgage bonds, China’s central bank proposed replacing the US-dollar as the international reserve currency, - a clear sign that Beijing, the largest holder of $1.5-trillion of US-dollar bonds, is very worried about the inflationary risk of the Fed’s money printing operations.
Ahead of the Group-of-20 summit in London on April 2nd, the Kremlin published a plan for a supra-national currency to replace the US-dollar. “We have received proposals from our colleagues in China, detailed proposals,” said Russian President Dmitry Medvedev’s top economic adviser Arkady Dvorkovich. “Our positions are very similar. We have similar positions on the development of the international financial architecture,” he said. Still, Moscow cautioned that while discussions are underway, the emergence of the new global currency won’t happen overnight.
On May 27th, Dallas Fed chief Fisher told the Wall Street Journal, that “officials of the Chinese government grilled me about whether or not we are going to monetize the actions of our legislature. I must have been asked about that a hundred times in China. I was asked at every single meeting about our purchases of Treasuries. That seemed to be the principal preoccupation of those that were invested with their surpluses mostly in the United States,” he warned.
Indeed, Brazilian president Mr Lula da Silva, and Hu Jintao, China’s president, are already implementing a plan to bypass the US-dollar with the Chinese yuan and the Brazilian real in direct trade between the two emerging economic giants. Brazil and Argentina have signed an agreement under which importers and exporters in the two countries can receive payments in pesos and reals directly, without the need of using the US-dollar as an intermediary of exchange.
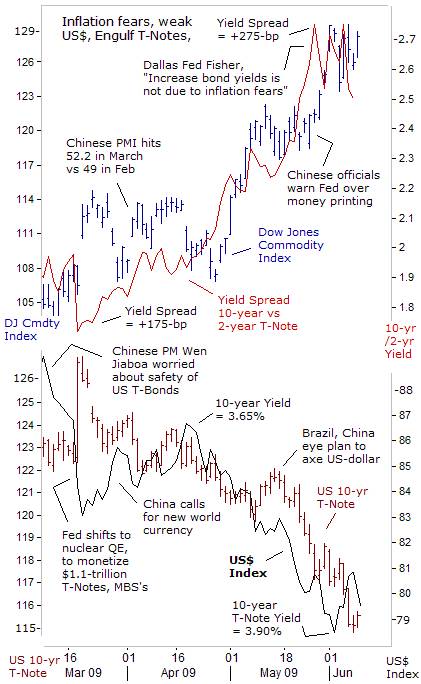
While speculators in the global stock markets see the “green-shoots” of economic recovery, Treasury bond vigilantes see a tsunami of US-dollars printed by Fed chief Ben “Bubbles” Bernanke, sparking a new wave of inflation worldwide. The US-dollar is tumbling in unison with a sliding T-bond market, - an ominous sign. Conversely, the sharp slide of the US-dollar is boosting the Dow Jones Commodity Index, up +25% since early March, while lifting crude oil above $70 per barrel.
The global financial crisis has hastened the day when the non-Western economies, such as Brazil, China, India, Korea, and Russia, will produce more than half of the world’s output, for the first time since the middle of the nineteenth century. By 2012, the Western industrialized nations will account for just 45% of the world economy, if current trends remain intact. China will overtake Japan to become the world’s second largest economy this year in dollar terms. And one of the knock-on effects of China and India’s resiliency is sharp rebounds in crude oil and commodity prices.
Beijing is injecting 9.2-trillion yuan into its economy, with fresh bank loans and fiscal spending, and is reviving industrial and speculative demand for crude oil, copper, iron-ore, steel, and other raw materials. Coupled with the hallucinogenic QE drug that is injected daily by central banks in England, Japan, the Euro-zone, Switzerland and the United States, into global money markets, the “Commodity Super Cycle, is reviving, fueled by an influx of “hot-money” using crude oil and other commodities as a hedge against inflation and a weaker US$.
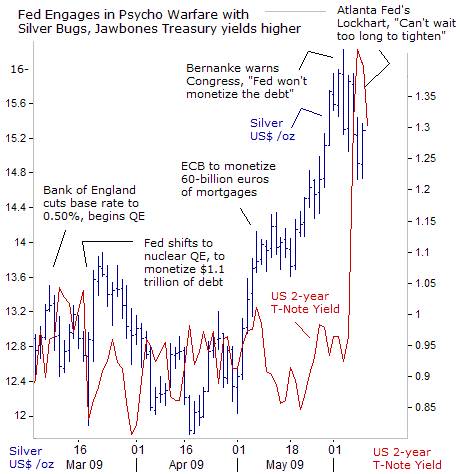
With the central banks of England, the Euro-zone, Japan, Switzerland, and the US, all engaging in a money printing orgy, traders are bidding-up the price of gold and silver, and anything that can’t be printed by central banks. After stabilizing above $12 /oz, the price of silver zoomed 25% higher in the month of May, towards $16 /oz, in-line with rising crude oil, copper, lumber, and soybeans.
But silver’s upward trajectory suddenly hit a roadblock at $16 /oz, hit by a burst of selling on June 3rd, after “Bubbles” Bernanke surprised the market. Bernanke warned Congress that the Fed would stop printing money at some point in the future. “Either cuts in spending or increases in taxes will be necessary to stabilize the fiscal situation,” Bernanke told the House Budget Committee. “The Fed won’t monetize the debt,” he warned. Of course, the million-dollar question is whether Bernanke is simply bluffing, and will ultimately succumb to political pressure to keep the printing press rolling this year, or rather, would the T-bond vigilantes gain the upper hand, and push interest rates higher, in order to contain inflation pressure.
In a knee-jerk reaction to Bernanke’s hawkish outburst, the yield on the Treasury’s 2-year note, which is very sensitive to perceived shifts in Fed policy, shot-upwards by 50-basis points to as high as 1.42-percent. That put a temporary lid on the surging gold and silver markets. “To the extent that yields are going up because the economic outlook is brighter, it would not be a good idea to oppose higher bond yields by boosting purchases of Treasuries,” warned New York Fed chief and former Goldman Sachs economist William Dudley on June 5th.
Yet on the next business day, the Fed quickly reversed course and monetized $7.5 billion of five-year Treasuries. “We want to be sure that we’ll be able to remove accommodation at an appropriate time and speed to insure that we don’t have an inflation risk down the road,” Bernanke said. “It’s not going to be easy, we’ll have to balance the risk on both sides, not going too soon and stunting the recovery and not going too late and having a bit of inflation,” he said.
From all appearances so far, Bernanke and his entourage of money printers, are merely giving lip service to fighting inflation, in order to buy some extra time, while the hallucinogenic QE-drug becomes more deeply embedded in the markets. Dallas Fed chief Fisher said there was “no exact formula” for when to start withdrawing the tidal wave of cash it pumped into the economy. “We just want to make sure we don’t repeat the mistakes made in the 1930’s and mistakes made by the Japanese in the 1990’s, by withdrawing cash too early,” he said in a speech in Lubbock, Texas.
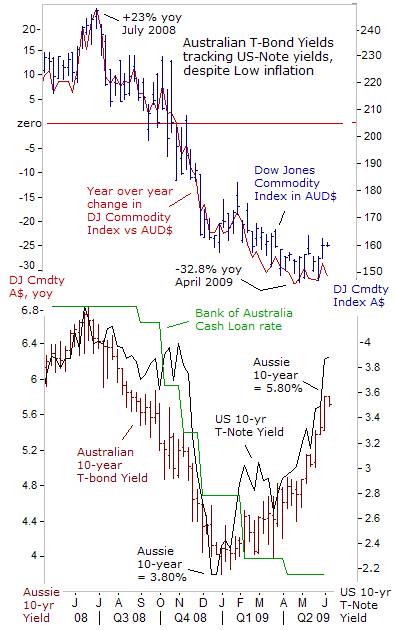
One of the other great mysteries in the financial markets is the behavior of the Australian Treasury bond market, which appears to be held hostage to the direction of US Treasury Notes, even though Australia’s budget deficit and inflation outlook are in a much healthier state. After hitting a historic low of 3.80% in late December, the yield on Australia’s 10-year T-bond has rebounded by 200-basis points to as high as 5.80% last week, mirroring the 190-basis point rebound in US T-Note yields.
While inflationary pressures are flaring-up in the United States, the inflation outlook is sanguine in Australia. In local currency terms, the Dow Jones Commodity Index is -31% lower than a year ago, thanks to a strong rebound by the Aussie dollar to 80-US-cents. The Bank of Australia is taking full advantage of the virtuous chain of events, by pegging its overnight cash rate at a historic low of 3.00-percent.
Australia’s budget deficit will be A$32-billion ($24.5-billion) in the year ending June 30th, before rising to A$57.6-billion in fiscal 2009-10 as a weak economy drives up unemployment and erodes tax receipts, Treasury chief Wayne Swan said. The budget deficit forecast for fiscal 2010 is equivalent to 5% of Australia’s gross domestic product, - far less than the US-budget shortfall at 13% of GDP. Yet despite a more sound fiscal condition and a lower inflation outlook, Australia’s bond yields are at the mercy of vigilantes operating in the US-debt markets.
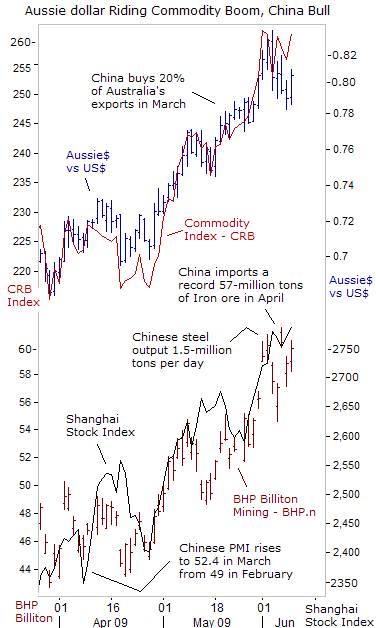
There’s little mystery surrounding the Australian dollar, which has rebounded above 80-US-cents, hitching a ride on the “Commodity Super Cycle” bandwagon, and China’s voracious appetite for iron-ore, crude oil, and agricultural commodities. Australia exported a record $4.4-billion to China in March, and $3.5-billion in February, enabling Australia to shrug-off the downturn in global trade in the first quarter, and notching its second-best trade surplus ever. Overall, China took one-fifth of Australia’s total exports in March.
Thanks to massive government spending on infrastructure, China’s daily crude steel output in May reached 1.5-million tons, equal to an annualized rate of 544-million tons. That compares with 500-million tons in 2008, lifting the fortunes of Australia’s top iron-ore miners, BHP Billiton and Rio Tinto. China’s imports of iron ore is on a record-breaking run, reaching an all-time high of 57-million tons in April.
The Reserve Bank of Australia (RBA) kept its powder dry for a second month, holding its cash rate steady at 3.00% on June 2nd, but threatened to cut rates further from a 49-year low, if currency traders try to bid the Aussie dollar much higher. Still, traders expect the RBA’s overnight cash rate target will be higher in 12-months, judging by the shape of Australia’s yield curve. Last week, 10-year yields briefly rose to +208-basis points above the 2-year yield, the widest in decades.
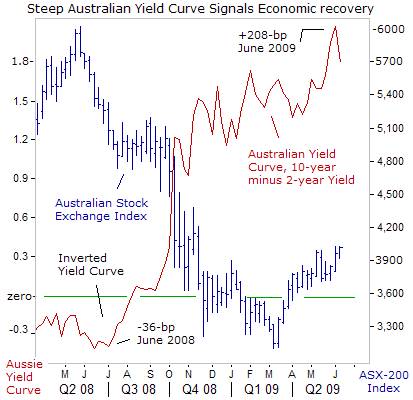
A year ago, Australia’s yield curve was inverted at -36-basis points, while the RBA was targeting its key cash rate at a 12-year high of 7.25-percent. The “Commodity Super Cycle” was reaching its all-time high, and the RBA reckoned that huge price increases for Australia’s major commodity exports would deliver a big windfall of as much as $A212-billion to the local economy in the year ahead.
However, the inverted shape of the Aussie yield curve argued otherwise. On July 3rd, 2008, Australia’s /ASX 200 Index tumbled to a two-year low, on worries that a surge in crude oil above $144 per barrel would choke off global economic growth. BHP Billiton, the world’s largest mining company, and BlueScope Steel tumbled alongside plunging consumer discretionary stocks and financials. By year’s end, the Australian share market ended -41% lower, its worst year ever with investors looking back on losses of more than A$700-billion.
The ASX-200 index dropped a further -10% in the first three-weeks of 2009, taking its plunge to more than half in just 14 months, one of the worst in the world. Seven of Australia’s biggest customers - Japan, the US, South Korea, Singapore, New Zealand, and Germany were officially in recession. Between them, China, Korea and Japan alone take 42% of Australian exports, mainly minerals and energy.
Yet today, traders see the “green-shoots” of recovery sprouting in the Asian tiger economies that revolve around the Chinese dragon. Combined with the steeping of the Australian yield curve, and the ASX-200’s climb to the psychological 4,000-level, the outlook for the Australian economy is brightening. On the other hand, while hopes for an extended summer rally abound, lurking beneath the surface of the G-10 capital markets are “Dangerous Divergences” that can trigger violent shake-outs in commodity and stock markets under certain circumstances, and explained in the latest edition of the Global Money Trends newsletter.
This article is just the Tip-of-the-Iceberg of what’s available in the Global Money Trends newsletter, for insightful analysis and predictions of the future direction of (1) top stock markets around the world, (2) Commodities such as crude oil, copper, gold, silver, steel, and soybeans (3) Foreign currencies, including exotics, (4) Libor interest rates and global bond markets (5) Central banker "Jawboning" and Intervention techniques that move markets.
By Gary Dorsch,
Editor, Global Money Trends newsletter
http://www.sirchartsalot.com
GMT filters important news and information into (1) bullet-point, easy to understand analysis, (2) featuring "Inter-Market Technical Analysis" that visually displays the dynamic inter-relationships between foreign currencies, commodities, interest rates and the stock markets from a dozen key countries around the world. Also included are (3) charts of key economic statistics of foreign countries that move markets.
Subscribers can also listen to bi-weekly Audio Broadcasts, with the latest news on global markets, and view our updated model portfolio 2008. To order a subscription to Global Money Trends, click on the hyperlink below, http://www.sirchartsalot.com/newsletters.php or call toll free to order, Sunday thru Thursday, 8 am to 9 pm EST, and on Friday 8 am to 5 pm, at 866-553-1007. Outside the call 561-367-1007.
Mr Dorsch worked on the trading floor of the Chicago Mercantile Exchange for nine years as the chief Financial Futures Analyst for three clearing firms, Oppenheimer Rouse Futures Inc, GH Miller and Company, and a commodity fund at the LNS Financial Group.
As a transactional broker for Charles Schwab's Global Investment Services department, Mr Dorsch handled thousands of customer trades in 45 stock exchanges around the world, including Australia, Canada, Japan, Hong Kong, the Euro zone, London, Toronto, South Africa, Mexico, and New Zealand, and Canadian oil trusts, ADR's and Exchange Traded Funds.
He wrote a weekly newsletter from 2000 thru September 2005 called, "Foreign Currency Trends" for Charles Schwab's Global Investment department, featuring inter-market technical analysis, to understand the dynamic inter-relationships between the foreign exchange, global bond and stock markets, and key industrial commodities.
Copyright © 2005-2009 SirChartsAlot, Inc. All rights reserved.
Disclaimer: SirChartsAlot.com's analysis and insights are based upon data gathered by it from various sources believed to be reliable, complete and accurate. However, no guarantee is made by SirChartsAlot.com as to the reliability, completeness and accuracy of the data so analyzed. SirChartsAlot.com is in the business of gathering information, analyzing it and disseminating the analysis for informational and educational purposes only. SirChartsAlot.com attempts to analyze trends, not make recommendations. All statements and expressions are the opinion of SirChartsAlot.com and are not meant to be investment advice or solicitation or recommendation to establish market positions. Our opinions are subject to change without notice. SirChartsAlot.com strongly advises readers to conduct thorough research relevant to decisions and verify facts from various independent sources.
Gary Dorsch Archive |
© 2005-2022 http://www.MarketOracle.co.uk - The Market Oracle is a FREE Daily Financial Markets Analysis & Forecasting online publication.


