


Stock Market Hesitation at Resistance
Stock-Markets / Stock Index Trading Jun 06, 2009 - 09:39 AM GMTBy: Jack_Steiman

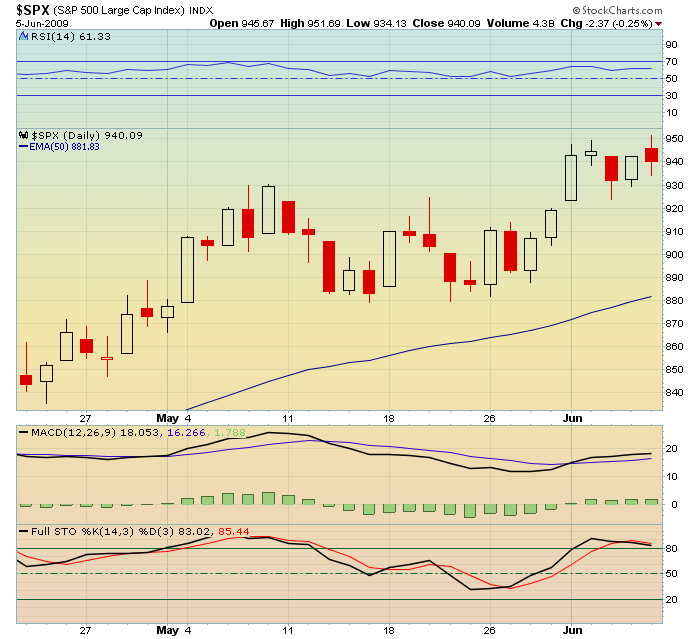
 So is the market done here? We gapped over the 200 day exponential moving average on the S&P 500 at 943. Last night I talked about how I felt we would likely gap up and over that level today based on how we closed yesterday. It didn't matter it almost seemed like what the news was going to be from the jobs report. The news was bad. 9.4% unemployment versus 9.2% expected. The market somehow didn't care and flew higher on the report. Slow erosion began just before the market opened but we still gapped up nicely.
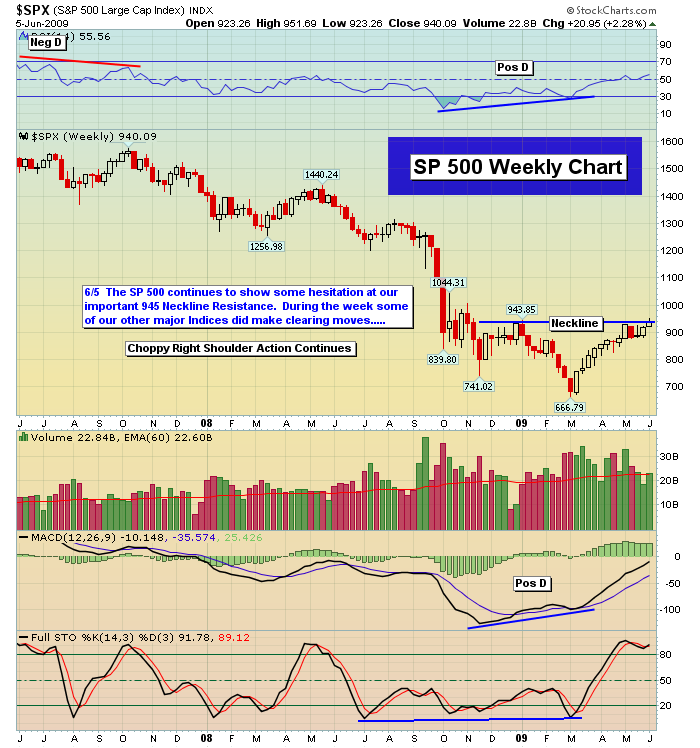
However, I warned about gap and run versus gap and churn. Gap and churn was dangerous for the market and that's what we got. The market just couldn't get going once the gap up occurred and the day was spent slowly moving down from the nice gap up open. Nothing terrible but downward all day. This caused the candles on the daily charts to tell us some near term caution is warranted. Black and in some cases, even red candles off the gap up and that normally means the very near term market is going to struggle a bit. When a market is moving up and you get a gap off the up trend and you reverse off major resistance -- in this case Sp 943 or that nasty 200 day exponential moving average -- you usually get a reversal for some days. It doesn't mean the reversal will be devastating to any degree. It just tells us that we will likely need to unwind the oscillators which have gotten a bit overbought on the major indexes.
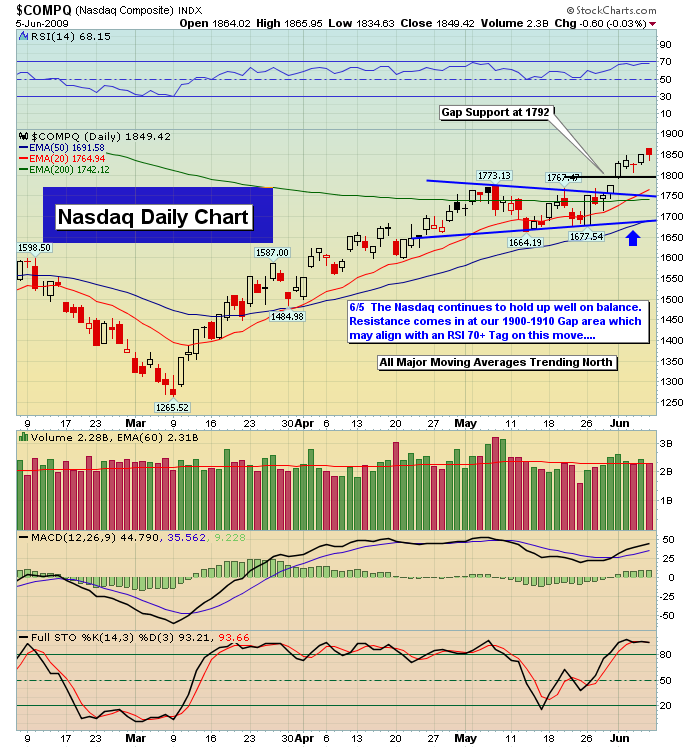
That will probably allow the market to gain the fuel necessary to try this very difficult level again in the near future. We have had two attempts now at this 943 Sp number and when a gap at this level fails, expect some losses in the very short term but again, this could be the medicine necessary to get through when most think we won't. With the Nasdaq continuing to hold well today, you add yet another day over its own 200 exponential moving average now at 1742. Super support there. It's quite possible we won't trade below that level for a lot longer than anyone thinks possible. Remember too that this number rises slowly each day. That's bullish. Bottom line is the short term doesn't look great for the bulls, but I don't expect anything terrible. Some unwinding of the oscillators is healthy. Add that the 60 minute charts aren't great from a macd perspective, and we should, I say should get some selling. The uptrend is strong so short sellers beware. If we get it, don't get too happy about it. This market over time may surprise the masses to the up side.
With the current up trend in place, the market has had a chance to develop a lot of support from the moving averages and gap ups. Let's go over those numbers just from the perspective of the daily charts. The Nas closed at 1849. If we had a decent pullback you see a tremendous confluence of support at the 1742 to 1765 area. You have the 20 day simple moving average at 1750 and the 20 day exponential moving average at 1765. Add in the big one, the 200 day exponential moving average at 1742 and the bears will have little to no success get the Nas below that confluence of support. the Sp closed at 940. There is gap support at 923. You have the 200 day simple moving average at 920. A nice duel area of support. Below 920 you have the 20 day simple and exponential moving averages at 911/912 respectively. So from 911 through 923, support is strong. And to put the icing on the cake, the Sp could fall all the way in time to the 50 day simple and exponential moving averages at 875/881 respectively and still be very healthy. The bears have their work cut out for them to get the Sp below its 50's and I personally don't think that's going to happen any time soon.
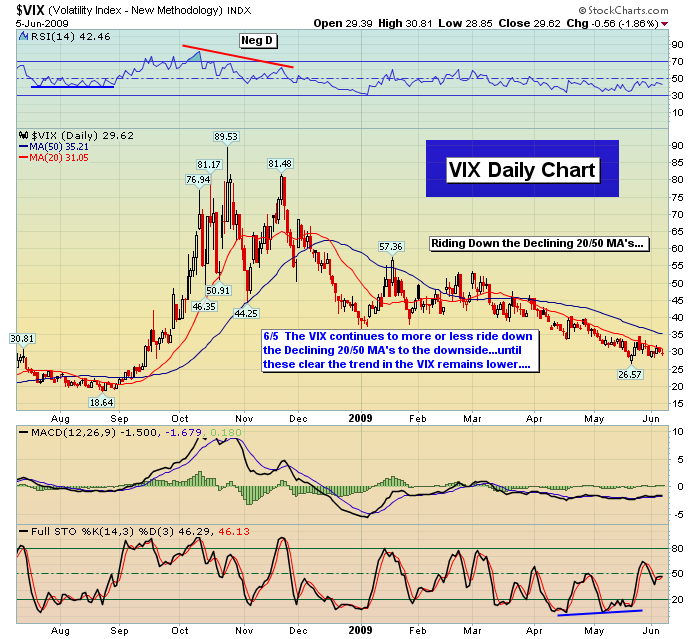
The market can take some solace, if you're bullish, in the behavior of the VIX. It continues to struggle mightily with its ability to move high. 30 is tough resistance as is 35 and although it gets higher than 30 on occasion, it is then unable to get close to 35 and move through. It's in a confirmed down trend. The technical's are poor at best and thus it'll be very difficult for the market to move appreciably lower for now. The VXN is telling the same story thus although again, we can and should move a little lower, expecting a dramatic move down just doesn't seem to be in the offing for now.
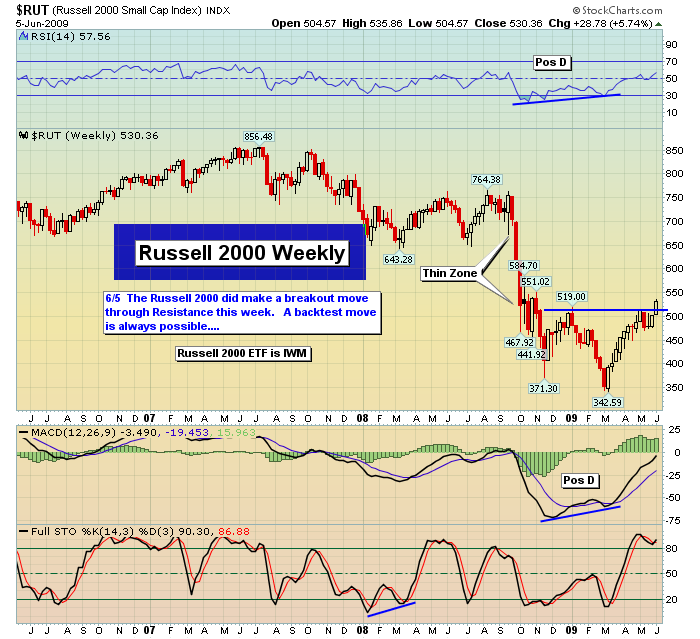
The banks were set up to breakout today but the oscillators and the bad unemployment report would not allow. These stocks are still looking good overall even with today's failure to break out of the wedge. It'll just simply pull back in to its base for now, but I would expect it to be able to hold within that base and make another try higher in time. The breakout in these stocks will be critical in the Sp's ability to break out over 943 and stay there. The great moves in stocks like Apple (AAPL), Research in Motion (RIMM), Google (GOOG) and Baidu (BIDU) were the main reason for the Nas to be able to get through its 200 day exponential moving average. The banks will have to do the job for the Sp or it just will never make it and hold. No technical damage from its failure today but I'll watch it closely on any selling to come short term.
It doesn't take much to get folks bearish on this market. At some point a decent selling episode will take place. That doesn't mean things are lost for the bullish case. A study of the weekly charts are very bullish. There will always be necessary selling periods to make the market healthier as oscillators unwind. I'll be watching a day at a time. Hang in there. A little selling here wouldn't be a bad thing.
Peace,
By Jack Steiman
Jack Steiman is author of SwingTradeOnline.com ( www.swingtradeonline.com ). Former columnist for TheStreet.com, Jack is renowned for calling major shifts in the market, including the market bottom in mid-2002 and the market top in October 2007.
Sign up for a Free 30-Day Trial to SwingTradeOnline.com!
© 2009 SwingTradeOnline.com
Mr. Steiman's commentaries and index analysis represent his own opinions and should not be relied upon for purposes of effecting securities transactions or other investing strategies, nor should they be construed as an offer or solicitation of an offer to sell or buy any security. You should not interpret Mr. Steiman's opinions as constituting investment advice. Trades mentioned on the site are hypothetical, not actual, positions.
Jack Steiman Archive |
© 2005-2022 http://www.MarketOracle.co.uk - The Market Oracle is a FREE Daily Financial Markets Analysis & Forecasting online publication.