


Crude Oil Imminent Trend Reversal
Commodities / Crude Oil Jun 06, 2009 - 08:45 AM GMTBy: Clive_Maund

 Oil has staged the relief rally predicted in the last Oil Market update posted early in March. Our original target was the $70 - $80 area, but due to the time it has taken to get to the current level, the target is now lowered to the current level or a shade higher. The reason for this is that the slower rate of ascent than expected has allowed the 200-day moving average to drop down further, so that it is now in the low $60`s and still dropping quite steeply and it is rare for the price of anything to push far past a falling 200-day moving average before it reacts back again.
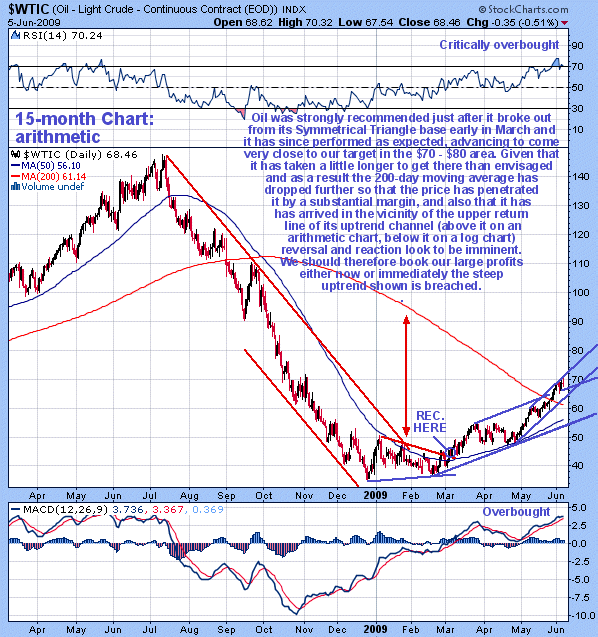
On the 15-month chart for Light Crude we can see how, following the severe downtrend last year, a basing pattern developed which took the form of a Symmetrical Triangle, the duration of which broke the price out of the major downtrend. We spotted the breakout from this triangle and turned bullish, and oil then entered the rather shallow uptrend shown. Within this uptrend we can spot two clear uplegs separated by a lengthy period of consolidation. If this uptrend is simply a bearmarket rally, then a 3-wave uptrend would be all that we would expect, which would mean that it is topping out now.
This, however, would probably only be the case if we see another wave of deleveraging that results in another rout of the commodity and stockmarkets, but we also know that massive inflation is being incubated by the US Federal Reserve as it attempts to solve all problems by the simple expedient of creating money, and this is not just happening in the US but around the world, as most countries resort to the printing press as the easy way out of economic problems and to play "beggar thy neighbour" by depreciating their currencies in an attempt to gain competitive advantage. So over the longer-term term commodities such as gold, silver and oil are set to soar.
Right now the time has come again to make a concerted effort to shore up the ailing dollar and the Treasury market - this has to be done immediately or they will collapse. This is why an across the board reversal in commodities was predicted on the site a couple of days ago, coinciding with a dollar rally - the big levers are being pulled in the opposite direction once more. While there is no guarantee that they will succeed of course, as with passing time they will eventually lose control, it is considered safer to assume that they will have at least limited success on this occasion and get a dollar - Treasury rally going over the next few weeks. Both are deeply oversold at this point so they have the technicals on their side. Thus, given the overbought condition of gold, silver and oil, it is reasonable to expect a reaction in coming weeks as the dollar and Treasuries take a breather before they most probably plunge anew. At the time of writing the dollar is rallying strongly although Treasuries are still heading south.
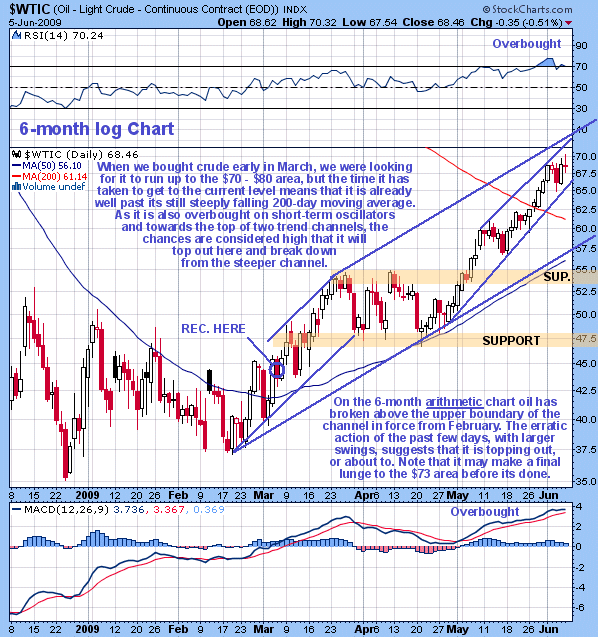
On the 6-month chart for Light Crude we can examine recent action in more detail. Here we see that the 2nd upleg from late April, which has resulted in an approximate $20 gain in the oil price, has been in progress for some 5 to 6 weeks now, so it is "getting long in the tooth" and there are factors pointing to its imminent exhaustion. This uptrend has taken the oil price up towards the top return line of the larger channel in force from February, calling for a reaction soon, especially as short-term oscillators such as those shown have been taken up close to their normal overbought extremes and the price has also run way ahead of its rising 50-day moving average.
We can also see that the advance has taken the price some way above the still quite steeply falling 200-day moving average, the red line on the chart, which means that oil is really "asking for it" here. On most occasions, when anything rises up through a steeply falling 200-day moving average, its gets hammered right back down again. There is scope for the price to make a final lunge at the upper trendline of both channels over the short-term, and if this happens it will get to the low 70`s, however, due to the recent bearish candlestick action, this is considered unlikely - more likely is that a reversal will occur from the current level, or a very little above.
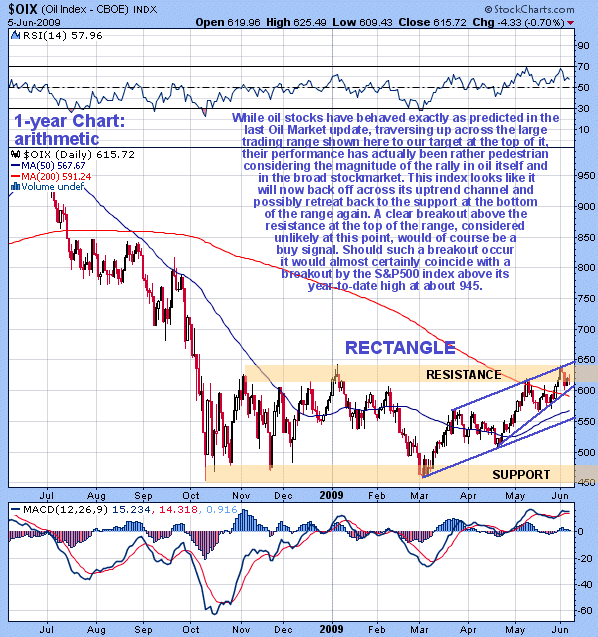
Oil stocks, as shown by the OIX oil index, have traversed from the bottom of their large trading range right back up to our target at the important resistance level at the top of it, as predicted in the early March Oil Market update. The question now of course, is whether "that's it" and they are set to react back across the trading range again. Based on what has been written above in relation to the crude charts, we would surmise that oil stocks are set to react back, a process which may have already begun in recent days. On our 1-year chart for the OIX oil stock index we can see how they have just stalled out beneath a clear zone of strong resistance, and this and the fact that they have pushed some way past a still falling 200-day moving average, like oil itself, certainly suggest that a reaction back across the range is likely soon, and final confirmation that a reaction has set in will be provided by the index breaking down beneath the inner steeper uptrend line shown.
A breakout above the resistance would of course be a buy signal, and this would seem to depend as much on whether the S&P500 index can succeed in breaking out above its January highs, which is looking possible at this point, as on the performance of oil itself. While it looks unlikely, it would be prudent to be open to the possibility. The general tactics for those long oil stocks are therefore clear - you can afford to stay long while the inner steeper uptrend line shown on the OIX index chart remains unbroken, for the chance, considered rather slim at this point, of an upside breakout above the strong resistance. If such an upside breakout occurs you can increase positions, and those on the sidelines can go long, but with close stops. Otherwise positions should be scaled back on a clear closing breach of the inner steeper trendline. We scaled back positions in oil stocks on the site last Tuesday morning, ahead of Wednesday's sharp drop.
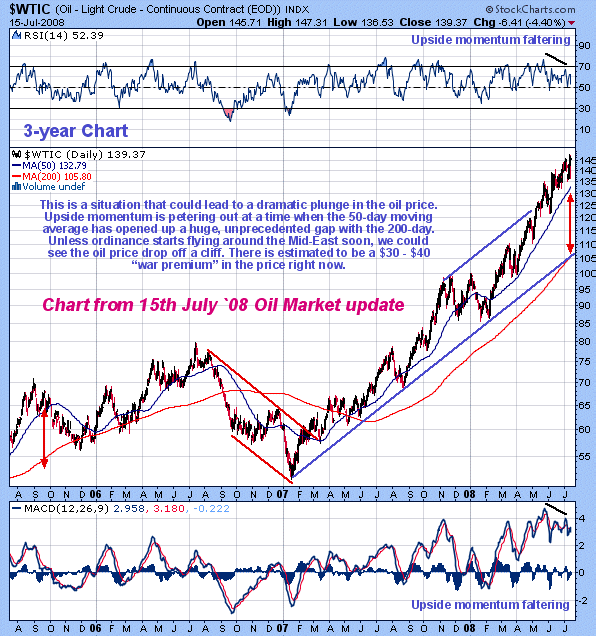
While these technical updates may seem rather long-winded and abstruse to some readers, the purpose of them is eminently practical - to assist traders in making money in these markets. Not only was the recent big rally in oil and oil stocks called right at its inception early in March, but the brutal bearmarket in oil last year was called the moment it began. Some of you may recall the following chart that was part of an Oil Market update posted in the middle of last July...
By Clive Maund
CliveMaund.com
For billing & subscription questions: subscriptions@clivemaund.com
© 2009 Clive Maund - The above represents the opinion and analysis of Mr. Maund, based on data available to him, at the time of writing. Mr. Maunds opinions are his own, and are not a recommendation or an offer to buy or sell securities. No responsibility can be accepted for losses that may result as a consequence of trading on the basis of this analysis.
Mr. Maund is an independent analyst who receives no compensation of any kind from any groups, individuals or corporations mentioned in his reports. As trading and investing in any financial markets may involve serious risk of loss, Mr. Maund recommends that you consult with a qualified investment advisor, one licensed by appropriate regulatory agencies in your legal jurisdiction and do your own due diligence and research when making any kind of a transaction with financial ramifications.
Clive Maund Archive |
© 2005-2022 http://www.MarketOracle.co.uk - The Market Oracle is a FREE Daily Financial Markets Analysis & Forecasting online publication.
Comments
|
TraderJoe
06 Jun 09, 15:06 |
oil?
Your archive from last year from June to August, nothing about oil - Bullish on Gold and bearish on the dollar ALL WRONG ! |