UK Economy Set for Debt Fuelled Economic Recovery Into 2010 General Election
News_Letter / UK Economy Jun 05, 2009 - 07:55 PM GMTBy: NewsLetter
 June 4th, 2009 Issue #41 Vol. 3
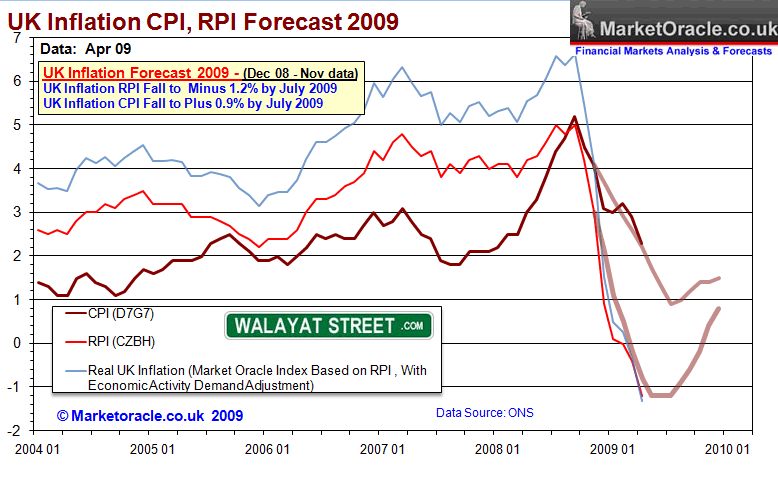
UK Economy Set for Debt Fuelled Economic Recovery Into 2010 General ElectionThis analysis seeks to update the UK Recession Watch (Feb 09) that forecast a recession which would see GDP peak to trough contraction of 6.3% and followed by economic recovery in the fourth quarter of 2009. In conjunction with the economic analysis, this article will also seek to forecast the date of the next general election as well as outcome of the vote in terms of MP seats per major party. The recession to date has seen GDP contraction of 4% which implies that the worst now 'should' be behind the economy, with average GDP contraction of less than 1% per quarter forecast for Q2 and Q3 thus should now start to be reflected in various economic indicators. UK CPI Inflation +2.4%, RPI Deflation -1.2% UK RPI Inflation data of minus 1.2% for April 09 represents severe deflation in the official data. Whilst the Governments preferred CPI inflation measure has recorded a smaller decline to 2.3% which still stubbornly puts it above the Bank of England's target rate of 2%. RPI deflation is not surprising given the panic interest rate cuts from 5% at the beginning of October 2008 to just 0.5% by the last cut of March 2009, these cuts in interest rates coupled with quantitative easing aka "money printing" to drive down long-term interest rates and hence mortgage rates is resulting in real deflation for those with large mortgages of as much as minus 5%, therefore this is providing for mini 'temporary' cash flow boom for those mortgage holders that have secure employment during the recession and therefore contributing to the summer bounce in house prices. However the bounce in house prices needs to be set against the bursting of the asset bubble that has seen UK house prices fall by 21% from the peak of August 2007. UK deflation in the face of the bursting of the asset bubble has now hit the inflation target of -1.2% and therefore expected to reverse trend on the RPI measure over the summer months with signs that the preferred measure of CPI is already warning of gathering inflationary clouds as the gap between RPI and CPI Inflation continues to widen to new extremes.
The trend in inflation data remains inline with my original forecast as of Dec 08 that forecast deflation into mid 2009, followed by a slowly rising inflationary trend during the second half of 2009. RPI of -1.2% will also have the effect of depressing wages as this measure is used to determine pay deals therefore deflationary whilst at the same time commodity price inflation is on the rise, as oil and petrol prices rise as speculators return to the markets and are starting to drive prices higher in advance of more visible signs of economic recovery. UK Money Supply - Deflation
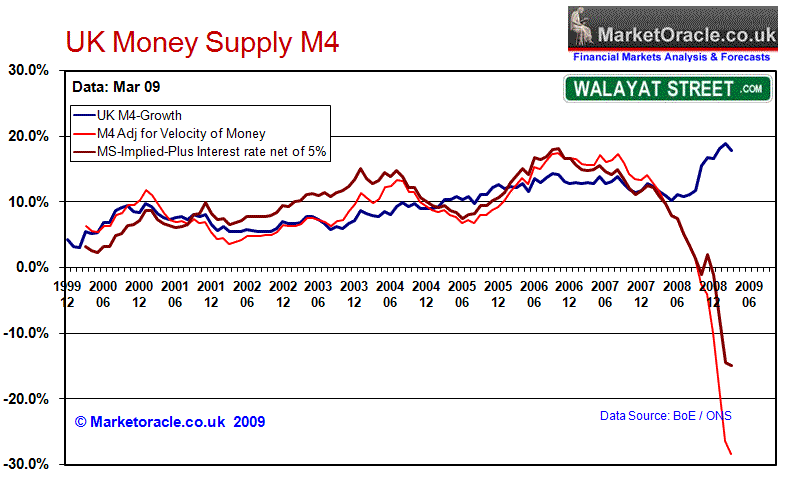
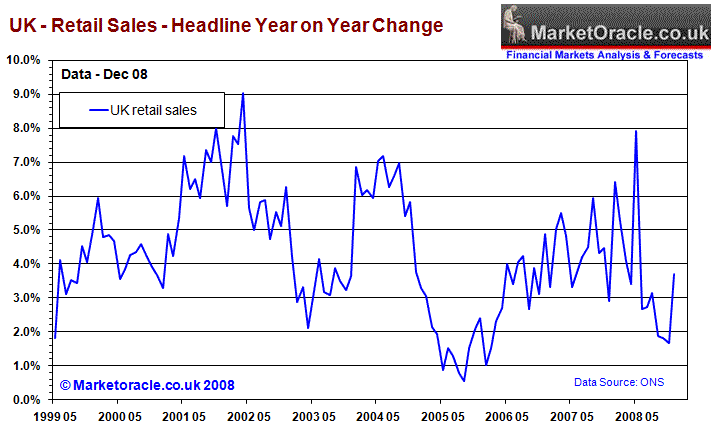
Whilst UK Money supply M4 (blue) has risen sharply from the 10% targeted low of mid 2008 to the current level of 17.7%, on face value this is highly inflationary and has been taken by some economists and market commentators to suggest much higher forward inflation. However the money supply adjusted for the velocity of money which takes into account the state of the economy as a consequence of the credit freeze tells a completely different story. The UK economy is now in extreme real monetary deflation of approaching -30%. The leading indicator of the implied money supply, is suggesting recent deep interest rate cuts to just 0.5% have so far failed to lift future money supply growth out of extreme deflation which therefore continues to suggest low inflation for the remainder of 2009. UK Inflation Conclusion - Extreme Deflation as measured by RPI is near an imminent end, forward inflation will continue to remain subdued despite economic recovery into the 2010 and therefore supportive of low interest rates. Retail Sales Recovery from Deflation The ONS finally came clean to confirm that the retail sales statistics are inaccurate and that it had revised the methodology in the way it calculates retail sales data, the data revision has ironically resulted in a better than expected boost to retail sales for a rise of 0.9% for April 09. The boost in retail sales data is inline with other observed trends in many areas of the economy which are feeding through towards a summer bounce in sectors of the economy such as for house prices. I recognised the inaccuracy in the published retail sales data many years ago which prompted me to generate my own retail sales data which more accurately reflected the condition of the high street then the official data which typically resulted in highly volatile retail sales month to month data with an overall positive bias that fed through into mainstream headlines which were contrary to what was actually taking place on Britians high streets as the graphs below illustrate. Retail Sales on Old Data (old data no longer available)
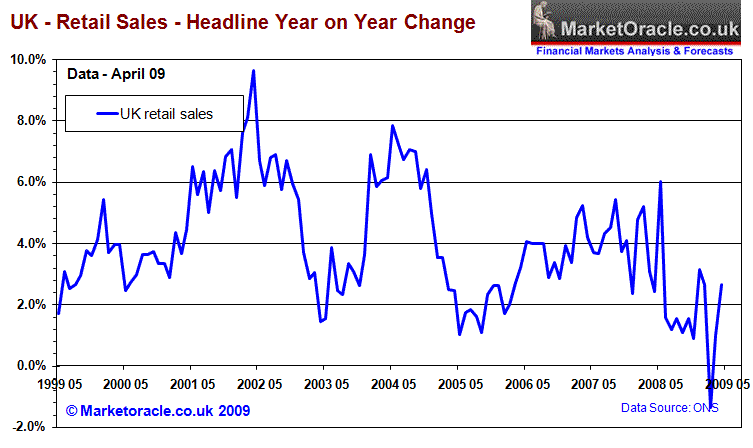
Retail Sales on New Revised ONS Method
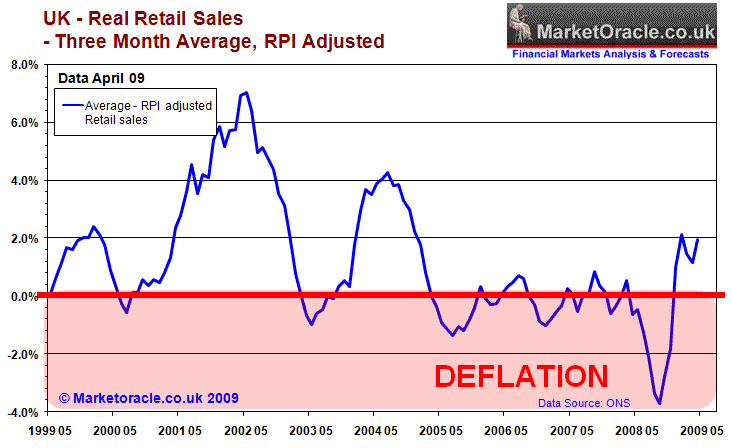
Clearly the changed methodology on calculating retail sales by the ONS has greatly reduced the positive bias in the data observed since 2005, that did not represent the true state of the high state i.e. spikes higher that implied a mini boom was taking place when in fact retailers were going bust as I have written about several times over the past 2 years, UK Retail Sales Rise 1.2%, Real Retail Sales Fall 1.3%. Real Retail Sales - Market Oracle Adjusted
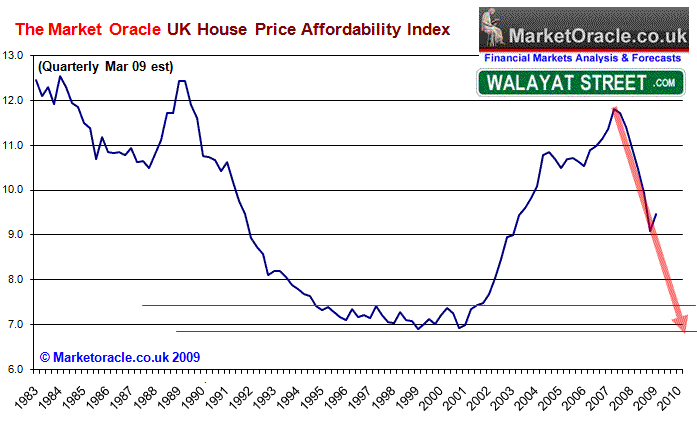
The adjusted retail sales data has continued to accurately present the true state of the retail sector for several years and most notably for the period going into recession. Similarly the data has started to indicate a strong retail sector recovery as a consequence of real deflation as RPI hits an unprecedented -1.2% for April 09. This retail sales bounce looks set to continue over the summer months and into early 2010 as a consequence of the Labour governments desperate attempt to ignite a mini consumer boom into a general election that must be held within the next 12 months. UK House Prices Summer Bounce Underway UK House prices have now fallen by more than 22% from the peak and down 13-16% over the past 12 months with the most recent data across a series of house price indexes such as that of the local government & communities, Nationwide and even the Halifax suggestive of near term support for UK house prices as we move into the seasonally stronger summer months. The unprecedented UK house prices drop of 22% to date has definitely sparked interest amongst prospective home buyers to venture out into the warm summer months after having held off from viewing / purchasing during the past 12 months. This new demand is reflected in data from estate agents who report a surge in the number of new buyers registering with their agencies to the highest numbers in 10 years. This is backed by Chartered Surveyors data (RICS) which show 70% of surveyors report a surge in new buyer inquiries. Therefore the UK housing market is definitely seeing liquid buyers return to the market which 'should' be reflected in rising house prices during the summer months that undoubtedly will increasingly be taken by the mainstream press to conclude that the house prices have bottomed. However the flaw in the analysis for those that will jump onto the bandwagon of a bottom in UK house prices is the fact that unemployment has not bottomed yet and is destined to continue rising higher to above 3,000,000 by the end of this year, which implies a weak UK housing market attempt, at best after the bounce UK house prices could stagnate into the 2010 election. Affordability One of the key drivers of the housing bear market is housing affordability levels which remain at extremely high levels which implies we are perhaps just past the half way mark in terms of house price bear trend as the below graph illustrates.
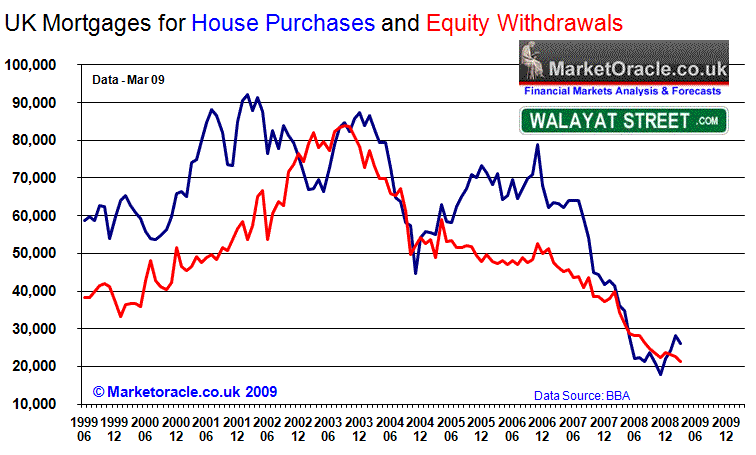
Mortgage Market The tightness in the supply of mortgages is reflected in the data, that is at near 1/3rd the level of the recent bull market peaks.
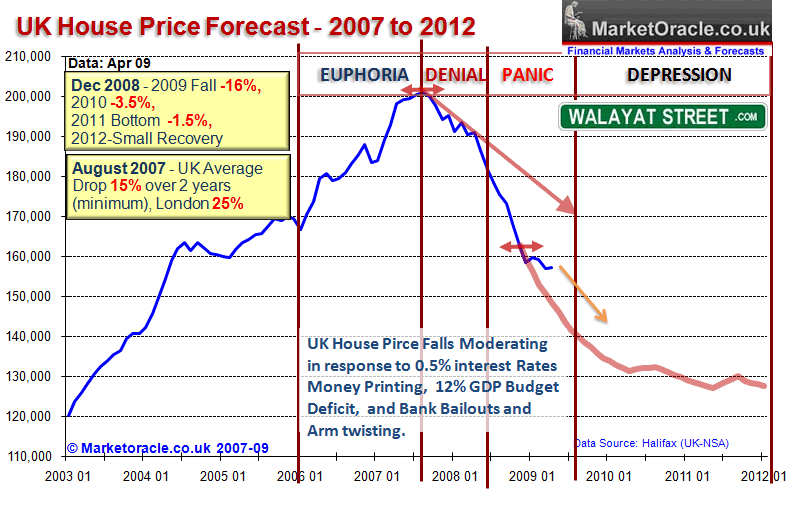
Repossessions and Negative Equity Whilst the number of repossessions is forecast to hit a high of 75,000 this year, matching the the early 1990's peak of 75,000, however this masks the impact of all of the government initiatives and bank arm twisting measures in an attempt to artificially keep people in their homes by a variety of means such as the "Mortgage Rescue Scheme" in the run up to the 2010 general election. This therefore means that reported repossessions data such as that from the Council of Mortgage Lenders (CML) will tend to under-report the true state of the impact of repossessions on the UK housing market as the reported repossession figures will mark but the tip of a much larger ice berg that could run to as much as a million home owners in arrears and helped to stay in their properties in one shape or another that will continue to impact negatively on the housing market price trend due to the supply of negative equity over hanging the market, that eagerly await a return to the housing boom to sell into. UK House Prices Forecast This therefore supports my recent in depth analysis which concluded that UK house prices could experience a technical summer bounce, however this bounce will not be sustained as once these new buyers have bought, the overwhelming bearish fundamentals will reassert themselves with the bear market resuming as the best the government can hope for is for housing market stagnation into early 2010 to try and hold the line. So yes, the UK housing bear market may pause for much of the remainder of 2009 and early 2010, however after the next election the downtrend is expected to continue for many more years at a shallower pace as the housing market depression will see house prices drift towards the forecast for a peak to trough contraction of approx 38%.
UK Interest Rates have Bottomed
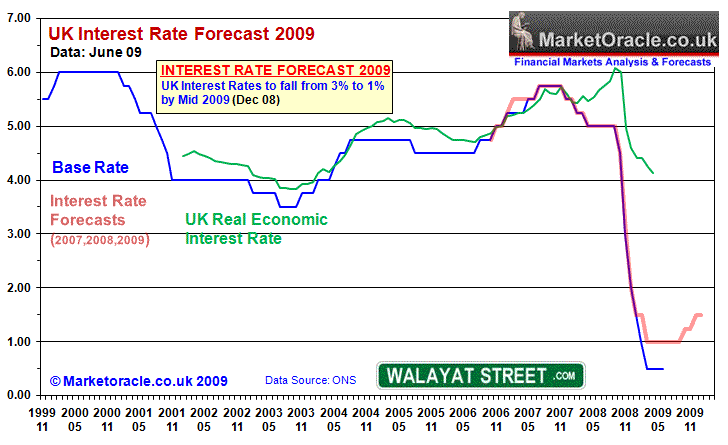
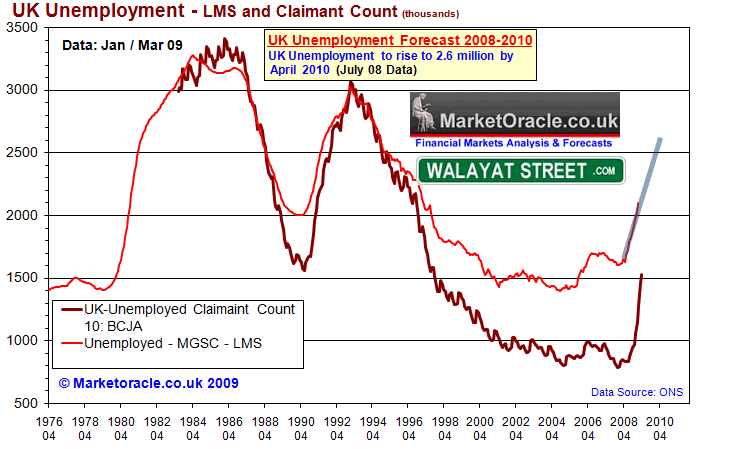
UK interest rates have bottomed at 0.5% in March 2009, I do not expect any change at Thursdays MPC meeting. Therefore the only question now is WHEN will UK interest rates start to rise again, my original forecast as of 4th of Dec 08 is for rates to start rising during the second half of 2009 as the economy begins to stabilise from free fall following the governments borrowing and deficit spending binge, though given the earlier weak inflationary expectations I do not expect any significant rise in UK interest rates this side of the next election. However whilst the base rate is at 0.5%, the real economic interest rate remains stubbornly above 4% with expectations that the large amount of government bonds to be issued this year will continue to put upward pressure on longer term interest rates and therefore the Bank of England is expected to continue to print money to buy government bonds. From an economic perspective, even a small rise in interest rates as I forecast 6 months ago, will not have any significant negative impact on the recovery and may in fact signal economic strength to the market place. UK Unemployment shot up by 71,000 for January 09 data to 12 year high of 2.1 million to officially stand at 6.7% of the workforce, 2.1 million is exactly on target as per my forecast of October 2008. However the more up to date unemployment claimant count data continued to soar, rising by 64,000 in March to 1.52 million, which is up more than 50% on the 970,000 figure of 6 months ago and acts as a leading leading indicator which signals much higher forward unemployment data as illustrated by the below graph
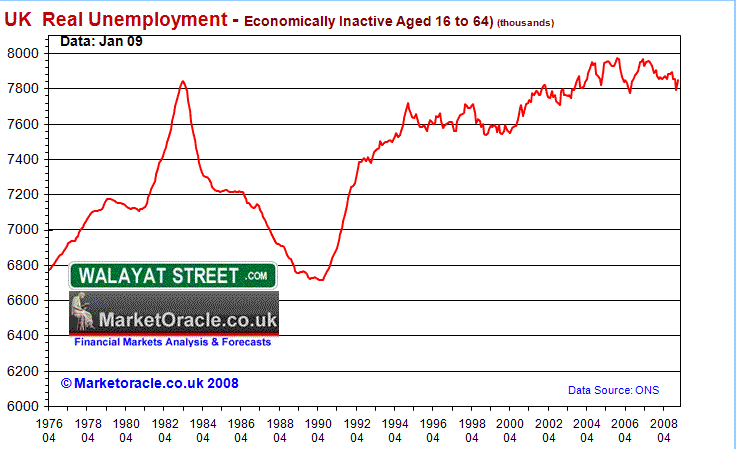
My original UK unemployment forecast based on July 08 data is for unemployment to rise to just above 2.5 million by April 2010, however a recession that projects to a GDP contraction of more than 6% implies that the UK is heading for an unemployment rate that could pass above 3,000,000 by the end of this year. The near vertical assent in the claimant count for Feb and March 09 totaling 241k implies sharply higher unemployment for Feb and March, this despite the fact that the unemployment statistics are heavily manipulated to under report true level of unemployment which would be 5.75 million higher if all those of working age (16 to 64) were included in the data as illustrated below, the actual dip in total inactive is due to net migration as eastern european workers are apparently returning home in the face of increasing difficulties in the UK labour market.
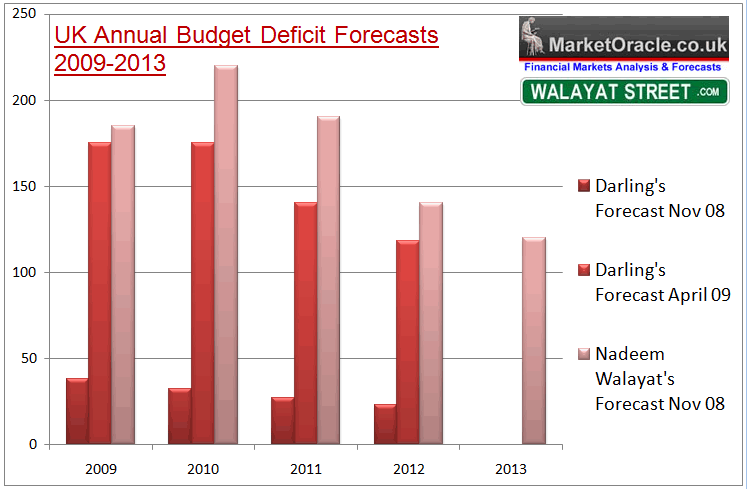
UK Unemployment Time bomb My Analysis of 21st February 09 ( UK Unemployment Time Bomb to Explode July 2009) warned that there exists the unemployment time bomb of the estimated 600,000 of school, college,leavers and graduates that are expected to join the labour market in July 2009 which could result in a surge of unemployment of as many as 250,000 in a single month, with also extra high unemployed numbers for subsequent months. This therefore implies that the 'real' economic recovery won't kick into gear until we see unemployment start to improve which is not likely to occur until the end of 2009. On the basis of data released to date it does suggest that fourth quarter growth will still be weak, as the Labour government does appear to have timed for the positive economic news to occur in the time window of March to May 2010. However if the peak in unemployment should occur earlier than it would be a strong leading indicator for economic strength. British Pound's Strong Bounce Back Whilst it is beyond the scope of this article to forecast sterling's trend, however the strong rally to above £/$1.60 is an leading indicator of economic recovery and thus higher interest rates. I will come back to an more in depth analysis of sterling in a future article, but I will say that in the immediate term sterling's strong rally may have run a little ahead of itself and implies corrective action especially against an deeply oversold U.S. Dollar i.e. towards a target of £/$ 1.50 especially in light of the political crisis in the UK. Labour Government Bankrupting Britain to Win the Next General Election The Labour government is reeling from the MP expenses scandal that looks set to see as many as half of its members of parliament disappear at the next General Election. A recent opinion poll in the Times puts Labour trailing behind the fringe Euro-skeptic UKIP party at just 16%, with the opposition Conservatives at 30% are failing to fully capitalise on Labours meltdown due to their own crooked MP's, and the Lib Dem's similarly skimming along at a low 12%. Whilst this and similar polls are dire for the Labour party which do suggest electoral wipeout in the June 4th European Elections, however they do not represent what is likely to occur at the May 2010 General Election which this article will seek to elaborate upon. In the course of updating the UK Recession Watch published last February that forecast peak to trough GDP contraction of 6.3%, and an economic recovery by the end of the this year, with subsequent analysis suggesting both a stealth stocks bull market and a bounce in the UK housing market, the most recent analysis to be published during June is increasingly suggestive of a clear strategy by the Labour Government of delivering a scorched earth economy to the new Conservative government whilst at the same time seeking to maximise the number of opposition MP's that the Labour party will able to field post May 2010. The key evidence of the scorched earth policy is in the record 12% budget deficit that the government will run this year and the deployment of quantitative easing for the primarily purpose of monetizing government debt so as to prevent government bond auction failures which would force interest rates higher. Both of these are aimed at generating a false bounce in the economy as the eventual consequences of both is higher inflation and interest rates. During the fourth quarter of 2008, the Labour government's goal was still to win the next general election and therefore the government response to the economic crisis was with a view towards leaving the country with an economy that was survivable in terms of electoral prospects at subsequent elections, which is why the government had at that time tried to both mask the amount of liabilities that the bankrupt banking system had forced onto the tax payers as well as tried to boost consumer spending without too much damage to the fiscal position of the countries finances by means of the £20 billion giveaway on VAT and other minor tax amendments. In November 2008, the government had not truly realised the magnitude of the debt crisis that faced Britain with Alistair Darlings forecasts way below reality, as the government was in denial of what was taking place and continued to clutch at straws, just as we witnessed with the Bank of England throughout most of 2008 that remained paralysed into in action by the fear of inflation all the way into October 8th 2008 when Gordon Brown seized control of monetary policy and forced the Bank of England to cut interest rates by declaring the first of a series of interest rate cuts himself at the Prime Ministers despatch box and for the BOE to abandon inflation targeting in favour of trying to win the next election at any costs resulting in zero interest rates and quantitative easing. The Debt Fueled Scorched Earth UK EconomyInline with the new policy of a scorched earth economy, the Chancellor Alistair Darling in his recent budget statement started to come clean on the huge amount of debt that the country will need to borrow on just its visible official balance sheet as illustrated by the below graph.
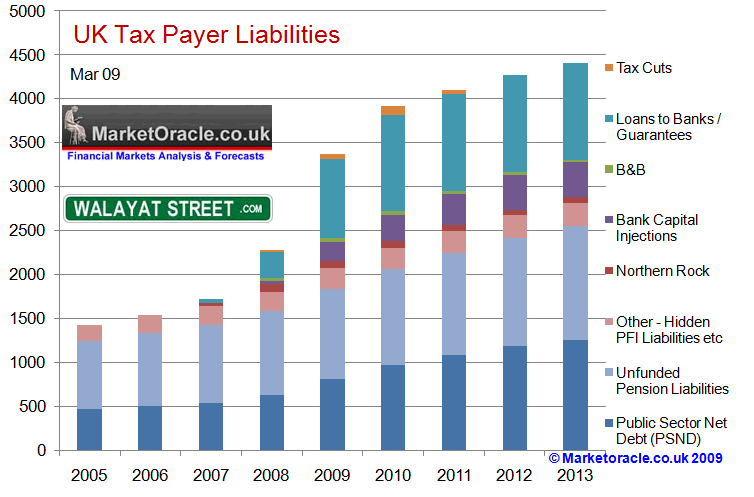
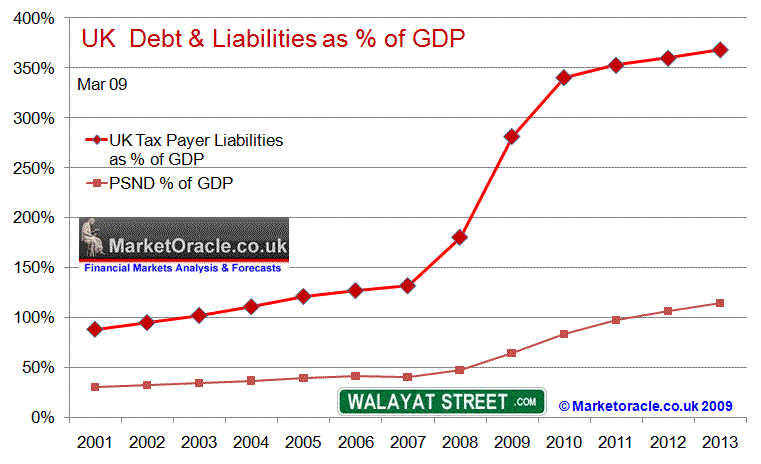
Alistair Darling's forecast for government net borrowing for 2009 and 2010 in November 2008 totaled just £70 billion. However now the amount of borrowing has mushroomed to £350 billion, which is set against my November forecast of £405 billion for 2009 and 2010 alone, with continuing large budget deficits thereafter. Alistair Darling also surprised many analysts by forecasting that the UK Economy would grow by 1.25% in 2010 and 3.5% in 2011. However we need to consider the following in that 1.25% growth on the annual GDP of £1.2 trillion equates to growth of just £15 billion and for 2011; 3.5% growth equates to just £42 billion. Therefore the government is borrowing a net £175 billion for 2009 and £175 billion for 2010 to generate £15 billion of growth, and then a further £140 billion for 2011 for £42 billion of growth. Thus total net borrowing of £490 billion to grow the economy by just £67 billion, (£595 billion my forecast) which shows the magnitude of the scorched earth economic policy now implemented that literally aims to hand the next Conservative government a bankrupted economy that will be lumbered with the consequences of continuing huge budget deficits throughout the life time of the next parliament and therefore sow the seeds for a strong Labour victory at the 2014-2015 General Election. Bankrupt Banks Bankrupting Britain Whilst some £500 - £600 billion of net borrowing over the next 3 years might sound alarming, however it literally marks the tip of the debt iceberg when it comes to Britians total liabilities that are set to grow from £1.75 billion at the end of 2007 to £3.9 trillion by the end of 2010 as a consequence of the £2 trillion of liabilities of the bankrupt banking sector being ceremoniously dumped onto the tax payers in addition to the deficit spending of £600 billion.
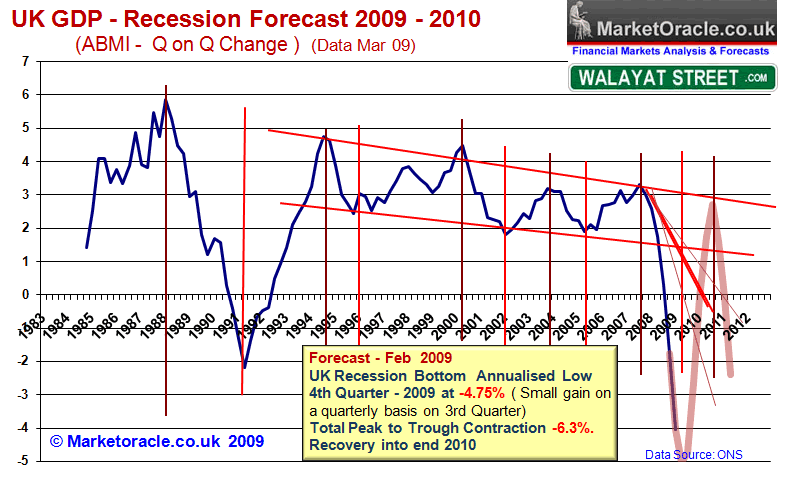
The consequences of all this deficit spending and growth in liabilities is highly inflationary as printing money eventually leads to hyperinflation as 1920's Weimar Germany found out, so Britain IS sowing the seeds of much higher inflation, maybe not this year and for the first half of 2010 as recent inflation analysis illustrated, but there will be a deficit spending and quantitative easing day of reckoning in terms of economic stagnation coupled with high inflation that will land on David Cameron's lap. In conclusion, the Labour government's primary objective now is to deliver David Cameron's Conservative government a scorched earth economy whilst at the same time engineering a debt fueled economic bounce to maximise the number of seats the party will be able to muster in opposition, therefore current opinion polls and projections of seats at the next election grossly under-estimate the actual number of seats Labour will win. UK Debt and Credit Ratings The credit worthiness of Britain was recently cut by S&P, whilst a significant marker enroute towards the bankruptcy of Britain is in itself not important as the market has already been marking down the value of UK government bonds as a consequence of the huge £220 billion of debt to be issued during 2009, therefore what the credit ratings say is pretty much irrelevant and more media hype than reality as those in the markets have ALREADY reacted to the policy of Quantitative Easing months ago. However, it is an apt time to remind the readership of the rating agencies such as S&P and others culpability in the fraud on investors where near worthless mortgage bonds were given and maintained a triple AAA credit rating all the way towards bankruptcy of the banking sector and near wipe out for investors who had been mislead by the credit agencies into thinking they were buying low risk bonds when they were buying extremely high risk. The reason for this were the fee's earned by credit ratings agencies from the investment banks that created the mortgage debt packages that were to be sold onto investors, hence culpability of the credit agencies. Perhaps the credit agencies are seeking a higher fee from the British Government to sustain British Bonds at the triple AAA ratings? The Government Will NEVER Repay the Debt One thing people need to understand and that is that the Government will NEVER repay the debt that they are borrowing today, NEVER, the amount of debt outstanding WILL ALWAYS GROW HIGHER, Why ? Because our economic system can ONLY function if the total amount of debt and hence supply of money is ALWAYS INCREASING, before the credit crunch debt increased or should I say exploded higher by means of banks creating money out of thin air by means of customers borrowing money from the bank that was turned into a liability AND AN ASSET TO LEND MORE MONEY AGAINST and therefore multiplying original fractional reserves by more than X30 per bank and if taking the whole closed loop banking system into account probably as much as X90, which is why a small % of defaults has resulted in the cascading bankruptcy of the whole of banking sector requiring tax payers liabilities that are expected to extend to more than £2 trillion. How Can Everyone be in Debt ? Welcome to the un-wonderful world of fractional reserve banking. The economy is built on credit that has been created by the banks by means of fractional reserve banking. The reason why the banks are bankrupt is because they have loaned out money many times over that they never had ! The countries banking system through the reserve requirement at the central bank (Bank of England) was supposed to regulate the amount of money or credit the banks created by a traditional factor of 9 to 1. Unfortunately as we are seeing the greedy, corrupt, culpable, and to all intents and purposes thieving banks have been lending many times that in league with an incompetent Bank of England, were talking forget X10, forget X20, forget even X30 that had been the limit until recent years, some of the greedy banks have been lending out as much as X60 of actual reserves, and hence why the British tax payer has woken up to an already £1.4 trillion hangover that continues to mushroom up towards £2 trillion. IF the incompetent buffoons at the FSA and the Bank of England HAD DONE THEIR JOB by running a SUSTAINABLE BANKING SYSTEM, Then the current crisis would be of several orders smaller, instead of £2 trillion+ of liabilities we would be facing liabilities in the region of £500 billion, which is STILL a big number but not so big that as we have seen today actually threatens the bankruptcy of the state! Not only would the liability to the tax payer be smaller, but the actual STRESS that the banking system is under would be less and therefore many more banks would be able to survive via capital injections from market place and in the final instance the tax payer. Unfortunately the Bank of England IS incompetent, the Treasury IS incompetent, the FSA IS incompetent the Labour Government IS incompetent, as they allowed those running the banks to turn them virtually all into hollow shells after having banked bonuses for fictional non existent profits, where a loss of a few % on bad loans brings the whole edifice crumbling down. My conclusion can only be is that both the Labour party and the Conservative party are deep in the pockets of the bankers, for instead of allowing the bankrupt banks to go bankrupt they have bent over backwards to ensure that the likes of Fred Goodwin can do a runner with millions more in tax payer cash which they would NOT have received had the banks gone bankrupt. As I voiced over 6 months, nay now approaching a year ago ! That the bankrupt banks should be allowed to go bankrupt with the profitable assets restructured and refloated as a retail bank that cannot make any calls on the money markets for funds thereby separating retail banking from investment banking activities. Instead of what the government should have done, the government is handing over literally unlimited amounts of cash in various off the countries balance sheet that ensures the tax payers will suffer the consequences of which for years if not for decades. How can we Prevent the Banks from Bankrupting the Country Again ? Firstly REAL REGULATION ! I am talking truly independent regulation along the lines of the courts system, none of this back slapping insiders on the boards of the likes of the FSA, who is in charge of the FSA ? Adair Turner, the former Vice chairman of Merrill Lynch. The prime requirement should be that the regulator is headed by NONE BANKERS. Secondly, we need to rethink our economic model, do we really want it to continue as an never ending expanding debt bubble economy that will periodically burst ? and more importantly seeks to enslave EVERYONE to the bankers and I MEAN EVERYONE ! That includes, individuals, corporations AND the GOVERNMENT. BEING IN DEBT EQUALS to BEING A DEBT SLAVE. You Work in part to PAY your Debt Slave Master, the Financial Institution that wrote your debt into existence at the tapping's of a few keys. Thirdly Fractional Reserve limits must be enforced at 9 to 1. - NO Banks should ever be allowed to leverage to more than X10 capital. Fourthly, an Independent regulator MUST BE COMPETANT ! The FSA HAS FAILED TO REGULATE THE BANKS. The sole responsibility of regulating the banks should be with an independent and restructured Bank of England, most of the current board should be dismissed, as i wrote a 9 months ago, the MPC committee at the monthly meetings apparently instead of acting sat sipping tea and talked about the weather. Fifthly - Accountable Bank Executives - The laws need to be greatly tightened where the culpable such as Fred Goodwin are actually made to account for their actions in a court of law, instead of being rewarded by ex-banker buddies in the government with multi-million pound cash lump sums on the tax payers backs. Sixthly - The credit ratings culpability in awarding of worthless mortgage bonds triple AAA ratings means we need some agency or organisation that is outside of the market place to rate debt i.e. independent and not reliant on earning an income from Seventh- INDIVIDUAL RESPONSBILITY - It is NOT ALL the bankers fault, many if not most individuals over a period of time turned themselves effectively into debt slaves, and now cry at the government to do something to alleviate themselves form their debt burden by the government punishing savers by cutting interest rates and devaluing the currency and also making it easier for debtors to default on their debts and wipe their personal slates clean via bankruptcy. The independent institution that overseas the regulation of the banking system needs to also have the duty of educating the population on the dangers of debt, and how to manage personal finances. This is even more important than competent regulation of the banks as once the population understands the value of money, debt and savings then they won't be sucked into crazy 100% mortgages at X7 salaries that set themselves up for default and the banking institutions up for bankruptcy. In summary , the credit crisis has enabled the general public for perhaps the first time to awaken from a 300 year debt induced coma to see the reality of the way our world works, where most people are born into perpetual debt slavery to work for the bankers and go through the phony process of voting for political parties who are in the pockets of the bankers and pander to their every whim as we have publicly witnessed where our countries future has been given on a platter to the banking industry. Rather than holding the thieving bankers to account, all the politicians have done is to utter a load of hot air, whilst letting the bankers to publically and blatantly rob the countries future. The so called 'socialist' Labour party has shown its true colours in the expenses crisis, and attitude towards lumbering tax payers with the bankrupt banks liabilities i.e. enslaving ordinary citizens who will pay for the crimes of the bankers for at least the next decade and thereafter continue to have the debt noose around their necks in perpetuality. Is the country run for the benefit of few thousand bankers and the political aristocracy made up of a few hundred greedy MP's that have cash funneled to in one shape or another, or for the other 60 million people ? Unfortunately neither the Labour party or the Conservative party that are swimming deep in the cesspit of abuse of tax payer funds offer the British Public a solution to 300 years of debt enslavement to the banking industry. Still voters can try and have their say within 12 months. UK Recession / Economic Recovery Conclusion Total GDP contraction to date now stands at -4% on a quarter on quarter basis, which is against my forecast for -6.3% total into Q3 2009, which strongly suggests that GDP contraction during the 2nd and 3rd quarters for 2009 'should' moderate i.e. we are unlikely to see another figure as bad as 1st Q -1.9%, more probably the 2nd quarter GDP is likely to be at -1%. Whilst a strong bounce back in the economy is expected going into the 2010 election given the extreme measures adopted most notable illustrated by the £500+ billion budget deficit to generate just £67 billion of additional economic growth, however the post general election tax hikes and deep public spending cuts will in all likelihood trigger a double dip recession during 2011 to 2012 as illustrated by the below graph. Therefore my growing expectations are for GDP contraction that is marginally less than the forecast -6.3%, which also implies stronger growth during 2010, which will not be sustained during 2011 and beyond.
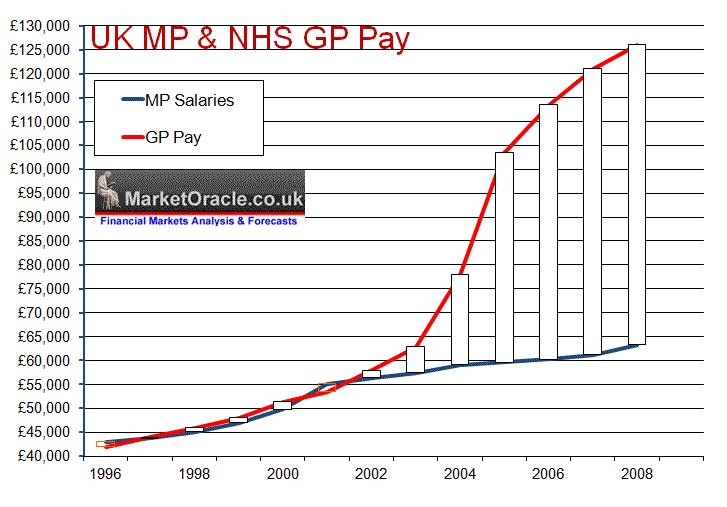
UK MP Expenses Crisis British voters have been outraged by the MP expenses scandal as each day the Daily Telegraph publishes more evidence of outrageous claims that tax payers have paid for. However the root of the problem lies in the fact that MP's fearful of voter backlash have under paid themselves relative to comparative professions such as NHS GP's as the below graph illustrates.
When Labour came to power in 1997 average MP pay was £43,722 against average NHS GP pay of £44,000, so both were inline with one another at that time. However as the above graph clearly illustrates that 2003 started to mark a serious divergence between GP and MP pay as GP Pay took off due to the new GP contracts that allowed GP's to award themselves pay hikes of 30% per annum that has lifted average GP pay to £126,000 per annum against £64,000 for MP's. MP Pay Solution The best solution to the current crisis would be if MP's were paid NO second home allowances but instead their salary was raised to £98,000 per annum and similarly over paid GP's pay was CUT to £98,000 per annum and thereafter BOTH groups pay is indexed. This will that MP's no longer feel the urge to defraud the system due to a significant pay disparity against GP's. This measure will also result a huge saving to the tax payers as 650 MP's would cost the tax payer an extra £15.6 million a year, against 30,000 GP's pay reduction to £98,000 saving the tax payers £840 million a year. UK General Election Forecast 2010, Seats Per Political Party Thursdays European Elections are expected to deliver an horrendous result for the Labour government that will likely see a major restructuring of the cabinet on Friday that could even claim the Chancellor of the Exchequer as Gordon Brown seeks to put in place a team untainted by the the expenses scandal to muster at the next general election. Increasingly panicking Labour MP's fearful of losing their seats at the next election are now in open rebellion against the Prime Minister, with a secret email that appeared a few hours ago seeking to add MP's to a list aimed at removing Gordon Brown from Number 10. Dear Gordon. Over the last 12 years in government, and before, you have made an enormous contribution to this country and to the Labour Party, and this is widely acknowledged. However, we are writing now because we believe that, in the current political situation, you can best serve the Labour Party and the country by stepping down as party leader and Prime Minister and so allowing the party to find a new leader to take us into the next General Election. The strategy is for the rebellion to reach critical mass of 60 or 70 Labour MP's which would be enough to force Gordon Brown's hand bring about a Leadership challenge. However, the above analysis clearly illustrates that the UK economy is showing signs of having put the worst behind it and that Britain is on track for a strong economic bounce going into the Summer 2010 election deadline primarily due to the Labour government borrowing to spend a net deficit of more than £500 billion to generate growth of just £67 billion which in effect delivers David Cameron's Conservative government a scorched earth economy whilst at the same time engineering a debt fueled economic bounce to maximise the number of seats the party will be able to muster in opposition, therefore current opinion polls and projections of seats at the next election grossly under-estimate the actual number of seats Labour will win. General Election Forecast In 2005 the three mainstream parties polled:
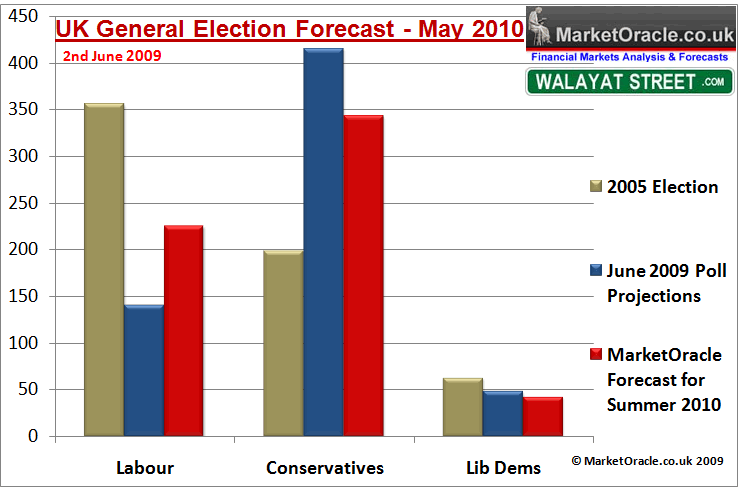
The most recent poll in the Daily Mail puts Labour on a 20+ year low of just 18%, Conservatives on 40% and Lib Dems also on 18%. The mainstream press are running with headlines of a Tory landslide victory at the next general election, such as the Sun newspaper forecasting a landslide Conservative majority of 192 or 414 seats in total. Therefore considering the projected debt fueled economic recovery, the current opinion polls and this weeks European Election results can be disregarded as not reflective of the prospects for the major parties at the next general election, which I suspect will prove to deliver the Conservatives a far smaller majority as the below forecast graph illustrates.
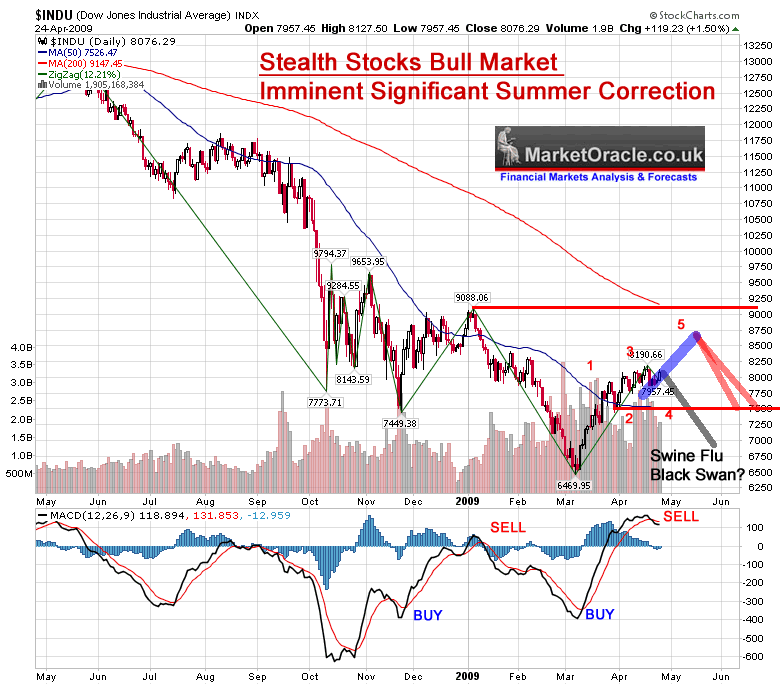
The general election forecast is for 225 seats for Labour and 343 seats for the Conservatives which implies a Tory government with a much smaller majority of 36 than the 192 being bandied about in the mainstream press this week, which would mean that the next Conservative government will not be able to implement many of the more radical reforms necessary to restructure the economy in terms of deep cuts in public spending and therefore suggests a weaker government that could by mid-term at the the mercy of rebel euro-skeptic MP's much as John Majors government of 1992 to 1997 experienced. This is potentially bad news for the economy as it confirms my expectations of continued stagnation for most of the term of the next government i.e. low average growth coupled with above average inflation as a consequence of not being able to mend countries finances which is likely to continue to see large year on year budget deficits and therefore achieves the Labour parties strategy of delivering a scorched earth economy to a Conservatives one term crippled government, that sows the seeds for a landslide Labour victory come the 2014-2015 election. Meanwhile the Lib Dems are expected to see their strong gains of 2005 all but disappear due to the fact that many of the Lib Dem marginal seats are against the Conservatives rather than Labour, and given the strong swing to the Tories the Lib Dem's blood bath could even be worse than that for Labour with potentially as many as half of Lib Dem seats being lost. When Will the Next General Election be Held? Way back in October 2007 when Gordon Brown bottled out of calling a general election, I warned that he had blown his chances of winning the next election and given that the economy was on the crest of the wave of a housing market crash which implied that the next election could not take place until May 2010. The statement clearly indicates that there will be no election during 2007 or 2008, and given the economic circumstances of expectations for sharply lower growth during 2008 and 2009, it is highly likely that Gordon Brown will now postpone an election until the full five year term is over. Which now suggests the next UK general election will be in April or May 2010. As things look today, Gordon Brown appears to have well and truly blown his chances of getting re-elected at the next Election in 2010. - Nadeem Walayat - October 2007. The forecast housing market crash of 2007 to 2009 has come to pass with all of the economic consequences and much worse. However now given the anticipated trend for economic recovery well into 2010 the best strategy for the Labour government still remains to delay calling the general election for as long as possible, this therefore continues to suggest that the next general election will probably take place in May 2010 i.e. just a few weeks before the June 3rd 2010 Deadline, as further confirmation the odds for a May 2010 election has fallen from 30-1 in October 2007 to just 1/2 today (Ladbrokes). Off course a complete meltdown of the Labour party could bring about an earlier election, though given the above economic analysis I doubt it. Stocks Stealth Bull Market Quick Update In response to a dozen email requests, this is a quick update to the ongoing Stocks Stealth Bull Market that began in early March 2009.The most recent analysis of April 26th concluded that the Dow is targeting 8,750 by mid May 2009 which was expected to be followed by a significant correction of 14%, the Dow hit this target yesterday (Tuesday 2nd June) and therefore expectations are now for this significant correction to materialise as indicated by the original chart below.
My next in depth analysis will cover the trend for the stock markets over the next few months, to receive this on the day of publication ensure that you are subscribed to my always free newsletter. By Nadeem Walayat Copyright © 2005-09 Marketoracle.co.uk (Market Oracle Ltd). All rights reserved. Nadeem Walayat has over 20 years experience of trading derivatives, portfolio management and analysing the financial markets, including one of few who both anticipated and Beat the 1987 Crash. Nadeem's forward looking analysis specialises on the housing market and interest rates. Nadeem is the Editor of The Market Oracle, a FREE Daily Financial Markets Analysis & Forecasting online publication. We present in-depth analysis from over 250 experienced analysts on a range of views of the probable direction of the financial markets. Thus enabling our readers to arrive at an informed opinion on future market direction. http://www.marketoracle.co.uk Disclaimer: The above is a matter of opinion provided for general information purposes only and is not intended as investment advice. Information and analysis above are derived from sources and utilising methods believed to be reliable, but we cannot accept responsibility for any trading losses you may incur as a result of this analysis. Individuals should consult with their personal financial advisors before engaging in any trading activities.
You're receiving this Email because you've registered with our website. How to Subscribe Click here to register and get our FREE Newsletter To access the Newsletter archive this link Forward a Message to Someone [FORWARD] To update your preferences [PREFERENCES] How to Unsubscribe - [UNSUBSCRIBE]
|
||||||||||||||
© 2005-2022 http://www.MarketOracle.co.uk - The Market Oracle is a FREE Daily Financial Markets Analysis & Forecasting online publication.


