Agricultural Commodities Trading: Wheat Retreat Keeps Base Incomplete
Commodities / Agricultural Commodities Jun 04, 2009 - 06:37 AM GMTBy: Seven_Days_Ahead
 An initial recovery in Wheat prices last year was subsequently almost completely reversed. Another attempt has reached the area of the previous recovery high, but bulls have lacked the s/term courage to push higher. However, the current pullback may be just the opportunity to jump on board before the next try.
The Commodity Trader’s view
 |
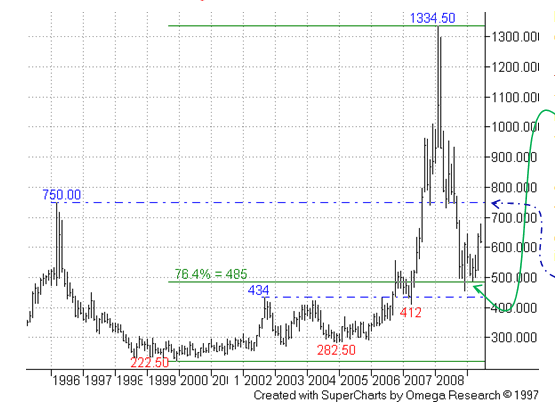
MONTHLY CHART – The collapse in Wheat prices found support from the 76.4% retracement of the 1999-2008 accelerating upmove.This particular Fibo retracement can often be most effective as support/resistance. On this long term chart the interesting overhead level lays around 750. |
 |
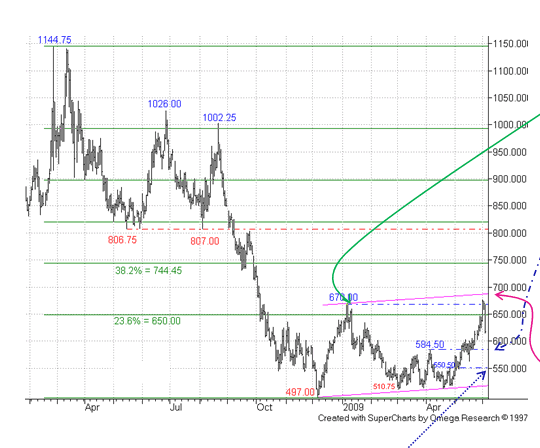
DAILY CHART – JUL-09: On this chart the initial Dec/Jan recovery pushed marginally beyond the 23.6% retracement before petering out. The subsequent pullback was deep, but stopped short of the 497.00 Dec low. The move through the 584.50 early Apr high was bullish, as highlighted in our previous Wheat Update of 03rd Apr-09. In the Commodity Trading Guide we thought the next interesting resistance was going to be the bull channel top projection at 690 currently. |
The pullback just ahead of this is perhaps no surprise – it warned against chasing the market after the brief breach of the 670 07-Jan high. We currently assume this is corrective/temporary prior to another bull attempt. Ideally support will come at/above that 584.50 high, else note lower support around 550 which corresponds with a 76.4% pullback level. A later break above the channel top would confirm that a medium term base was in place, and open up the 38.2% 744 level as the next target. Buyers on dips towards 584.50 will probably have initial stops below 550, targeting towards 690 for partial profits, and then the 740 area for more, tightening stops at least to cost along the way.
Note that last week’s Update on Cocoa pointed out a triangle formation, with a s/term bull signal given within this. There has now been an initial bull break from this pattern – ideally any pullback will find support above the 2519 08/11-May high now, and should be a useful reference point for buyers on dips.
Philip Allwright
By Mark Sturdy
Seven Days Ahead
Be sure to sign up for and receive these articles automatically at Market Updates
Mark Sturdy, John Lewis & Philip Allwright, write exclusively for Seven Days Ahead a regulated financial advisor selling professional-level technical and macro analysis and high-performing trade recommendations with detailed risk control for banks, hedge funds, and expert private investors around the world. Check out our subscriptions.
© 2009 Copyright Seven Days Ahead - All Rights Reserved
Disclaimer: The above is a matter of opinion provided for general information purposes only and is not intended as investment advice. Information and analysis above are derived from sources and utilising methods believed to be reliable, but we cannot accept responsibility for any losses you may incur as a result of this analysis. Individuals should consult with their personal financial advisors.
© 2005-2022 http://www.MarketOracle.co.uk - The Market Oracle is a FREE Daily Financial Markets Analysis & Forecasting online publication.


