Inflation or Deflation, Which is the Greater Risk Over the Next Five Years?
Economics / Inflation Jun 02, 2009 - 05:00 AM GMTBy: Paul_L_Kasriel
 I will not keep you in suspense. I believe that the greater risk for the global economy in general and the U.S. economy in particular is inflation, not deflation. I arrive at this conclusion both on secular and cyclical grounds.
Secular Factors
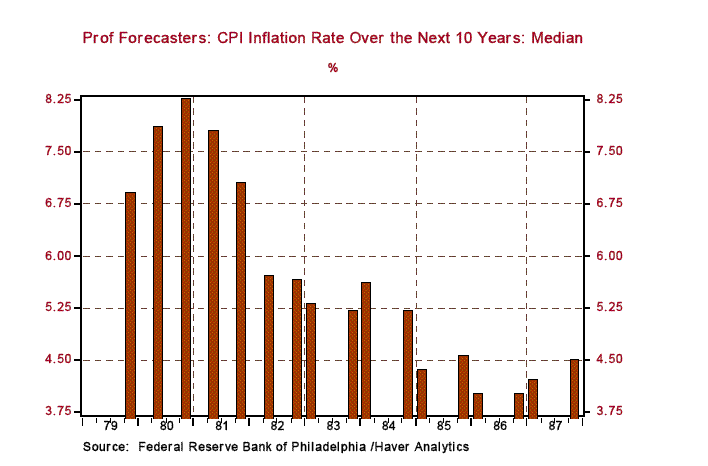
Let us begin by discussing the secular issues. In the U.S., the Great Inflation of the mid 1970s to early 1980s was counteracted by absolutely and relatively high inflation-adjusted federal funds rates initiated by former Fed Chairman Paul Volcker (see Chart 1). These high inflation-adjusted federal funds rates helped bring down actual inflation as well as inflation expectations (see Chart 2). As shown in Chart 1, in recent years the inflation-adjusted federal funds rate has been unusually low. This could be a factor that might lead to rising inflation expectations if investors view the level of the inflation-adjusted federal funds rate as a proxy for the Fed's anti-inflation resolve.
Chart 1
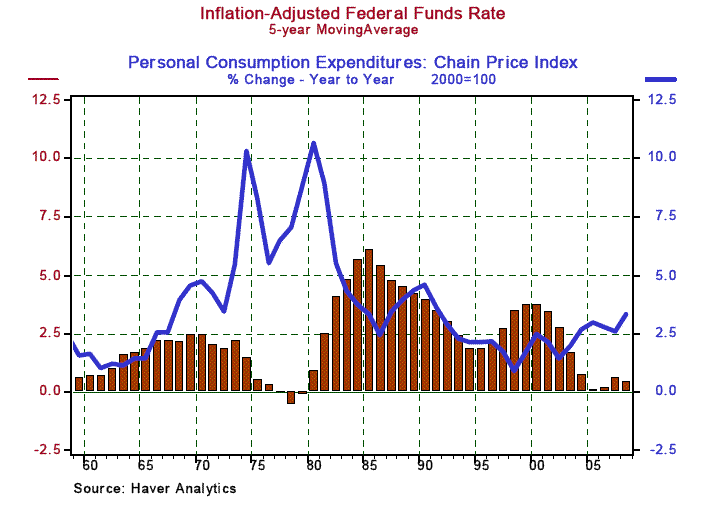
Chart 2
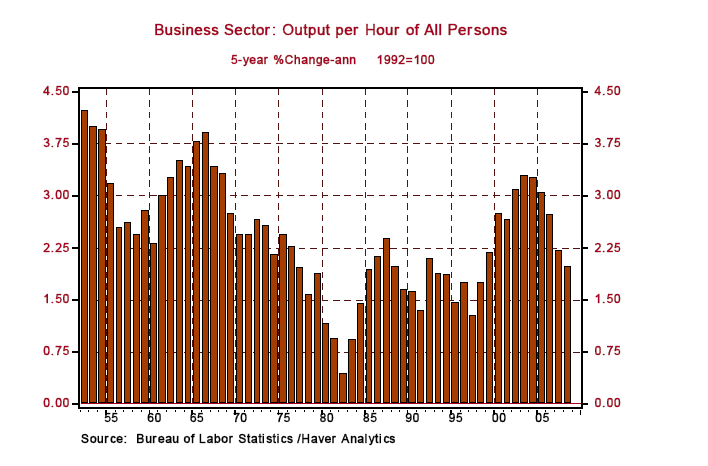
Another important secular disinflationary factor was the significant increase in U.S. labor productivity growth that commenced in the mid 1990s. To a large degree, this step up in productivity growth was the result of the implementation of information technologies developed in the 1980s. But, as shown in Chart 3, the productivity boom appears to be over for now.
Chart 3
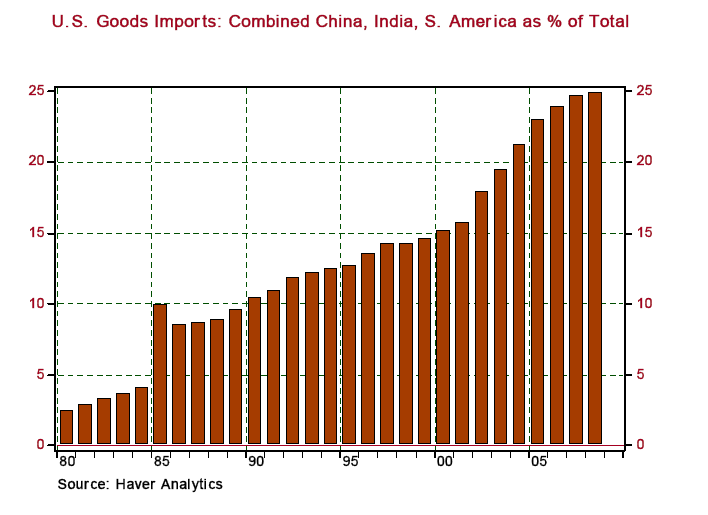
Coinciding with the productivity boom was a large increase in the potential global supply of goods and services resulting from emerging economies, especially the Chinese and Indian economies, becoming significantly more integrated in the global trading system. This rightward shift in the global supply curve for goods and services imparted a strong disinflationary impulse to the global economy. As shown in Chart 4, the GDP of Asian emerging economies rose from about 7% of world GDP in 1990 to over 14% of world GDP in 2007. Similarly, U.S. combined goods imports from China, India and South America went from about 10% of its total imports in 1990 to 25% of its total imports in 2008 (see Chart 5). Although the share of global GDP contributed by emerging economies is sure to grow in the next 10 years, will this share grow as rapidly in the next 10 years as it did in the past 10 years? If not, this secular disinflationary factor will diminish in magnitude.
Chart 4
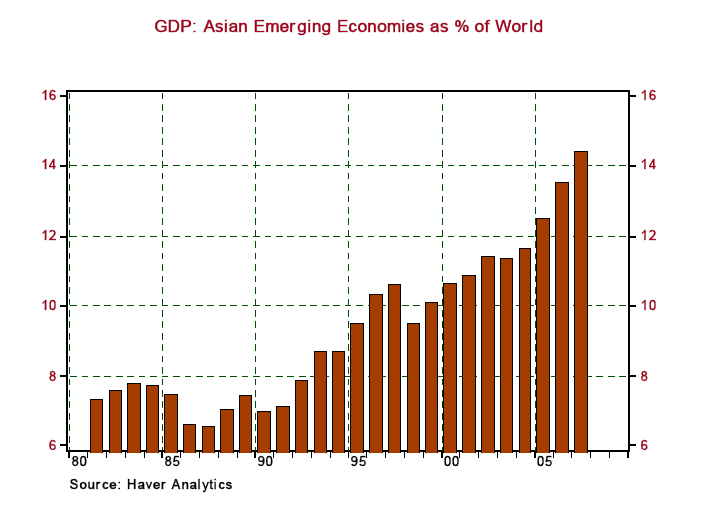
Chart 5
I would argue that government defense spending has a larger inflationary bias than many other types of government spending inasmuch as the public cannot directly consume defense production. Let me give an illustration. Suppose a motor vehicle plant and workers are used to produce automobiles. The assembly line workers can use their wage and salary income to purchase what they produce - automobiles. But if the plant and workers are used to produce army tanks, the assembly line workers are unable to purchase with their wage and salary income what they now produce. Unless real interest rates are allowed to increase to encourage saving on the part of the defense-plant assembly workers, inflation is likely to increase as these workers bid for a reduced available supply of goods and services available for private consumption.
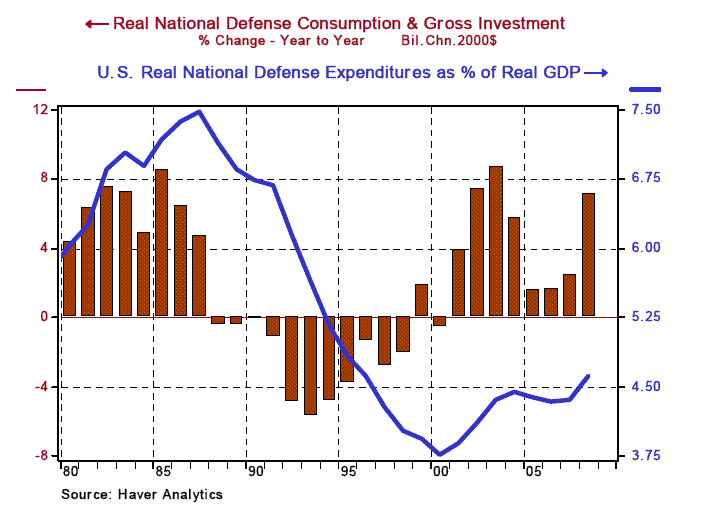
I bring this up because with the winding down of the Cold War in the late 1980s, U.S. defense expenditures in absolute as well as a relative terms began falling precipitously (see Chart 6). However, after the September 11, 2001 attacks on the U.S. homeland, defense expenditures are on the rise again. Although their growth rate may slow as the U.S. military involvement in Iraq is reduced, it is doubtful that defense expenditures will decline as they did after the end of the Cold War. Thus, another secular force for disinflation is eroding.
Chart 6
Diminished inflation expectations, a surge in productivity, the integration of emerging economies into the global trading system and reduced U.S. defense expenditures were secular forces that combined to bring down U.S. and global inflation in the past 15 to 20 years.
Neither Secular nor Cyclical Factors
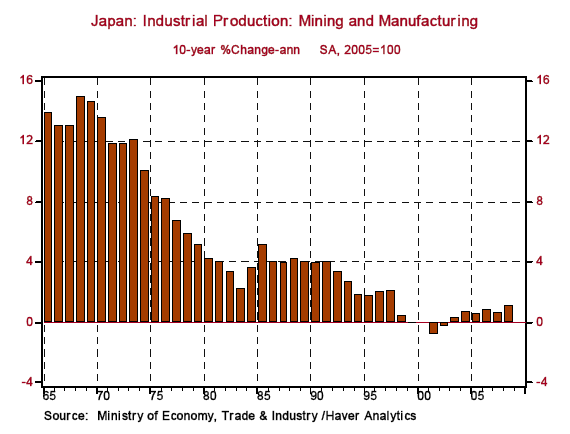
There are two other factors, lying somewhere between secular and cyclical, that also might have served to hold down inflation. The first factor was Japan's "lost decade." As shown in Chart 7, in the ten years ended 1991, Japanese industrial production grew at a compound annual rate of 4.0%; in the ten years ended 2001, industrial production contracted at an annual rate of 0.9%. This meant that in the ten years ended 2001, one of the largest industrialized economies had a much diminished demand for industrial commodities, which undoubtedly held down the prices of industrial commodities in particular as well as global inflation in general.
Chart 7
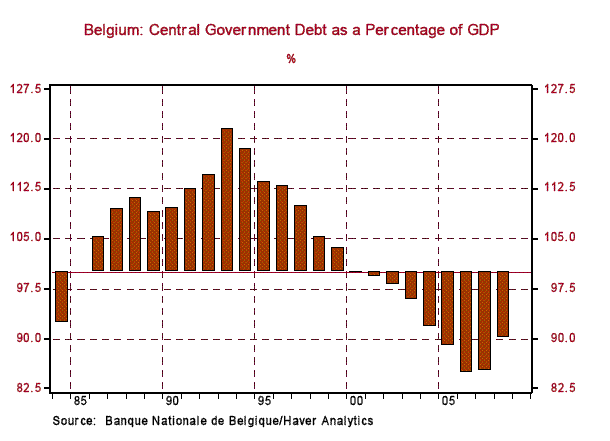
Lastly, in the run-up to the creation of the euro, in order to gain membership in the euro "club," some hitherto profligate government spenders temporarily developed fiscal prudence, at least on a relative basis. For example, Belgium, whose government debt was 121% of its GDP in 1993, declined to 104% of GDP by 1999 and fell further to 85% in 2006 (see Chart 8). However, the downward trend in the ratio of Belgian government debt-to-GDP appears to have reversed, as evidenced by increase to 90% in 2008. This newfound fiscal rectitude by Belgium and other euro "wannabes" likely took some pressure off interest rates in these economies and, thus, relieved some pressure on pre-ECB central banks to create credit. To the degree that Belgium is representative of diminishing fiscal discipline in the euro-zone, the ECB printing press could be revved up.
Chart 8
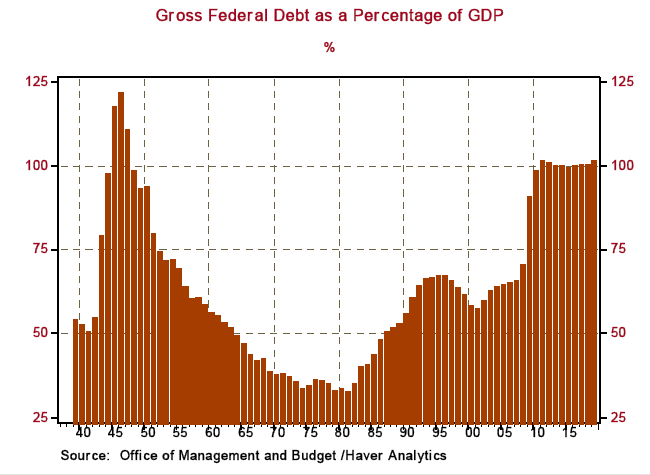
Speaking of fiscal profligacy, I would be remiss in not mentioning the U.S., the largest net debtor economy in the world. Chart 9 shows that total federal government debt, including debt owed to other government entities such as the Social Security Trust Fund by the Treasury, will rise from 70% of GDP in 2008 to 101% of GDP in 2011 and remains near 100% of GDP through 2019. Bear in mind, these projections of public debt-to-GDP ratios were made by the Obama administration's Office of Management and Budget rather than the nonpartisan Congressional Budget Office. So, a cynical person might think that these projections are on the low side. Again, given that the U.S. is a net debtor economy and given that all U.S. government debt is denominated in U.S. dollars, there will be a temptation to relieve real debt-service burdens on U.S. residents by "encouraging" the Federal Reserve to err on the side of creating some inflation rather than deflation.
Chart 9
So, these are some secular factors that had been imparting disinflationary impulses to the U.S. and global economies and now are reversing in the direction of inflationary impulses.
Cyclical Factors
Now, let's discuss some cyclical factors that will bear on the inflation outlook. These factors will be restricted to the U.S. economy because this is the economy for which the bulk of my empirical cyclical research is concentrated.
Mainstream economists tend to concentrate on the so-called output gap as the key determinant of the inflation outlook. The output gap is related to the difference between the current and projected levels of actual real GDP and the current and projected levels of potential real GDP. Typically, the output gap is defined as the absolute difference between actual and potential real GDP as a percent of potential real GDP. According to this view, the larger the output gap, the larger should be the inflationary impulse. Thus, the output gap and inflation would be expected to be positively correlated. Chart 10 shows a history of the percentage output gap plus Congressional Budget Office estimates for the years 2009 through 2012.
Chart 10
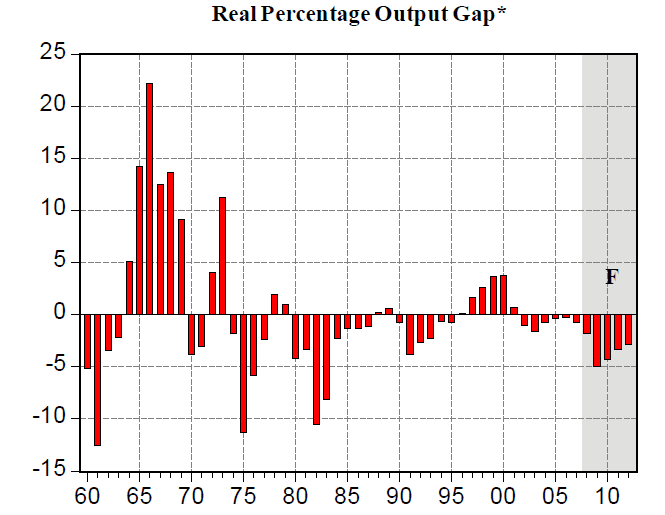
* Difference between actual and potential real GDP as a percent of potential real GDP.
CBO estimates were used for potential real GDP and actual GDP for years 2009 - 2012.
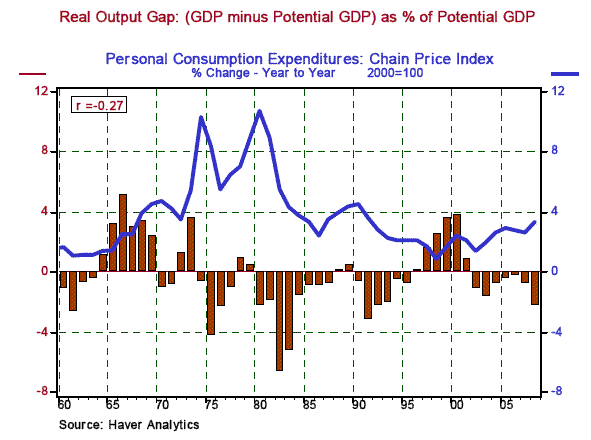
Chart 11 shows the coincident relationship between the real percentage output gap (using the Congressional Budget Office's estimates of potential real GDP) and the inflation rates as defined by the chain-price index for personal consumption expenditures. Not only is the absolute level of the correlation coefficient between the two series low at 0.27, but more importantly, the sign is negative, not positive, as hypothesized. But it is reasonable to assume that there are lags involved between the output gap and inflation. The highest positive correlation between the two series is 0.08 when the output gap leads inflation by two years. Using this admittedly crude analysis, it seems as though the output gap is not a very good guide to the cyclical behavior of inflation.
Chart 11
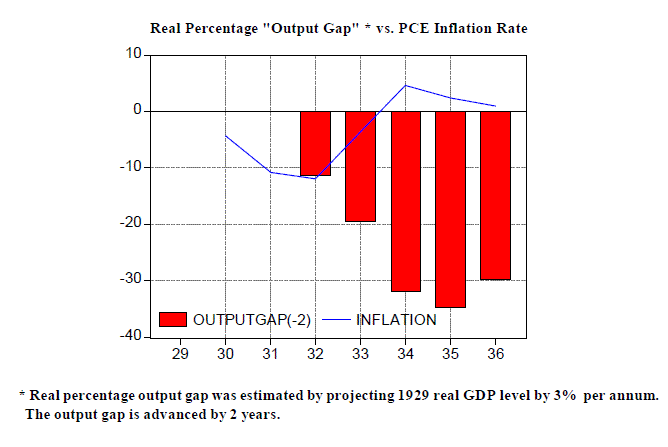
The behavior of inflation in the 1930s provides additional evidence as to the shortcomings of the output gap as a good predictor of inflation. I estimated potential real GDP for the years 1930 through 1936 by assuming 3 percent compound annual growth ( the actual annual compound growth rate in real GDP in the 28 years ended 1929) from the 1929 level of real GDP. The inflation rate, as measured by the percent change in the average annual personal consumption expenditure chain-price index, went from minus 3.6% in 1933 to plus 4.6% in 1934. The real output gap in 1934 was 29.8%; the real output gap advanced by two years, i.e., the real output gap in 1932 was 31.9%. In sum, as shown in Chart 12, the output gap was a poor predictor of U.S. inflation in the early 1930s.
Chart 12
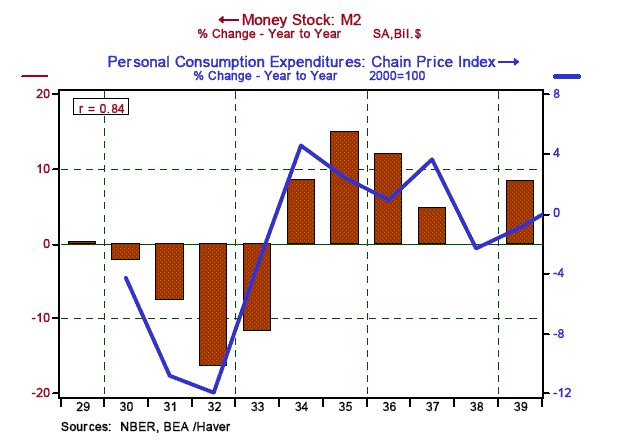
Some economists lurking in the tributaries as opposed to the mainstream, continue to hew to the Milton Friedman hypothesis that inflation is a monetary phenomenon. There is more compelling evidence in the postwar era supporting the Friedman hypothesis than the output gap hypothesis. In the 1960 through 2008 period, the M2 money supply growth advanced by three years has a positive (as expected) correlation coefficient with inflation of 0.64 (see Chart 13). In the first four months of 2009, the average level of M2 was 7.3% higher than the annual average for 2008. During the early 1930s, the highest positive correlation between the M2 money supply growth and inflation was 0.84 with M2 growth coincident to inflation (see Chart 14).
Chart 13
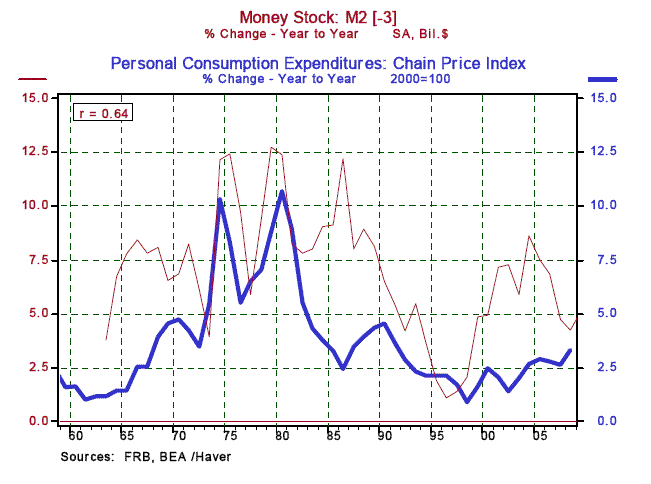
Chart 14
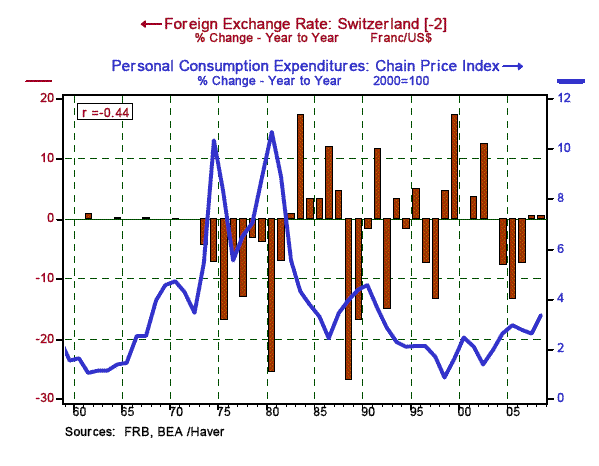
Another candidate to explain future inflation might be the behavior of the foreign exchange rate. The hypothesis would be that as the U.S .dollar appreciates relative to other currencies, with a lag, U.S. inflationary pressures would moderate. Thus, we would expect to see a negative correlation between lagged exchanges rates expressed as foreign currency-to-dollar and U.S. inflation. I have chosen the Swiss franc-to-dollar as the foreign exchange rate variable because it correlates well with the euro but has a longer history. Chart 15 shows that the highest negative correlation, 0.44, is obtained when the percentage change in this exchange rate is advanced by two years.
Chart 15
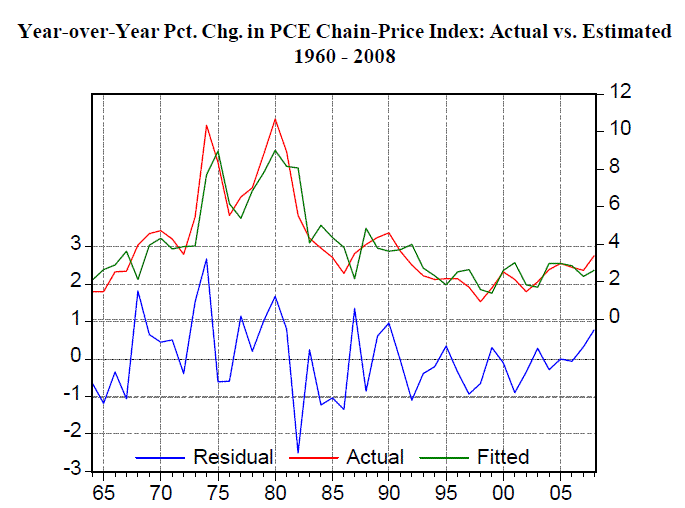
Let's use these three variables - the real percentage output gap, the M2 money supply growth and the percentage change in the Swiss franc-to-dollar exchange rate to predict U.S. inflation over the next two years. To do this, I have estimated an equation using an ordinary-least-squares equation. Testing different lags for the independent variables and adjusting for serial correlation, the "best" equation has M2 growth advanced by two years, the output gap advanced by one year and the Swiss franc advanced by two years (see table below). A graph of the actual inflation rate vs. its estimated value by the equation in Table 1 is shown in Chart 16.
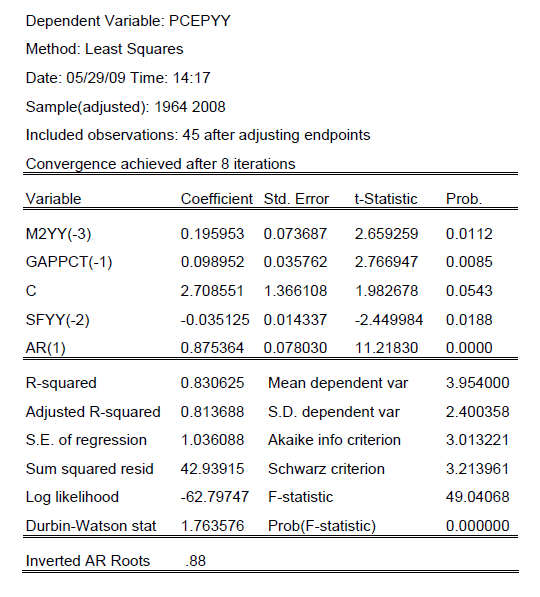
Chart 16
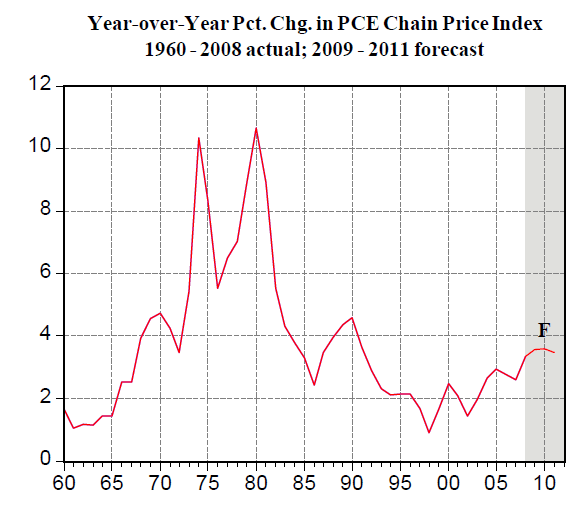
In 2008, the annual average change in the chain-price index for personal consumption expenditures was 3.35%. Using the estimated equation to forecast this inflation measure yields forecasts of 3.57%, 3.60% and 3.46% for the years 2009, 2010 and 2011, respectively (see Chart 17). It is highly unlikely that annual average inflation in 2009 will be higher than that of 2008. For example, the price index in Q1:2009 was 0.3% below the 2008 annual average. But the main point of this exercise is to demonstrate that even with relatively large output gaps in the near term, other factors point to, at least, continued inflation in the neighborhood of what has been experienced in recent years rather than persistently very low inflation or outright deflation. With the reversal of the aforementioned secular disinflationary factors in combination with cyclical factors such as relatively high money growth and the potential for a depreciating U.S. dollar, it seems to me that over the next five years inflation rather than deflation is the greater risk.
Chart 17
Paul Kasriel is the recipient of the 2006 Lawrence R. Klein Award for Blue Chip Forecasting Accuracy
By Paul L. Kasriel & Asha Bangalore
The Northern Trust Company
Economic Research Department - Daily Global Commentary
Copyright © 2009 Paul Kasriel
Paul joined the economic research unit of The Northern Trust Company in 1986 as Vice President and Economist, being named Senior Vice President and Director of Economic Research in 2000. His economic and interest rate forecasts are used both internally and by clients. The accuracy of the Economic Research Department's forecasts has consistently been highly-ranked in the Blue Chip survey of about 50 forecasters over the years. To that point, Paul received the prestigious 2006 Lawrence R. Klein Award for having the most accurate economic forecast among the Blue Chip survey participants for the years 2002 through 2005.
The opinions expressed herein are those of the author and do not necessarily represent the views of The Northern Trust Company. The Northern Trust Company does not warrant the accuracy or completeness of information contained herein, such information is subject to change and is not intended to influence your investment decisions.
Paul L. Kasriel Archive |
© 2005-2022 http://www.MarketOracle.co.uk - The Market Oracle is a FREE Daily Financial Markets Analysis & Forecasting online publication.


