Silver Stocks on the Rise
Commodities / Gold & Silver Stocks May 25, 2007 - 01:55 PM GMTBy: Roland_Watson
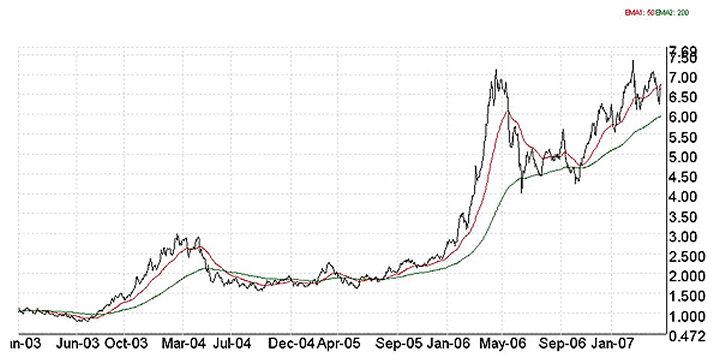
 While we await silver to press onto new highs, what is the current situation with silver mining stocks? If you go to Yahoo! Finance, you will find various indices to represent various mining companies with an emphasis on gold such as the HUI and the XAU. You will of course be able to check up on your favourite silver stock but there is no silver stock index one can consult. For that reason, I formulated my own Silver Analyst Stock Composite index or the SASC index for short. Its chart for the last 5 years is shown below being a composite of 14 well known stocks with a silver background. The 50 day and 200 day moving averages are also shown in red and green.

These 14 stocks are combined in value and then reset to 1 at the beginning of the silver bull market back in mid-2003. As you can see the current value has dropped from a recent high of about 7.50 to about 6.50. That means that a portfolio evenly invested in these 14 stocks would have increased in value seven fold between June 2003 and February 2007. Meanwhile, silver simultaneously leapt about 3.5 times, so you got a leverage of 2 to 1 on this basket of stocks.
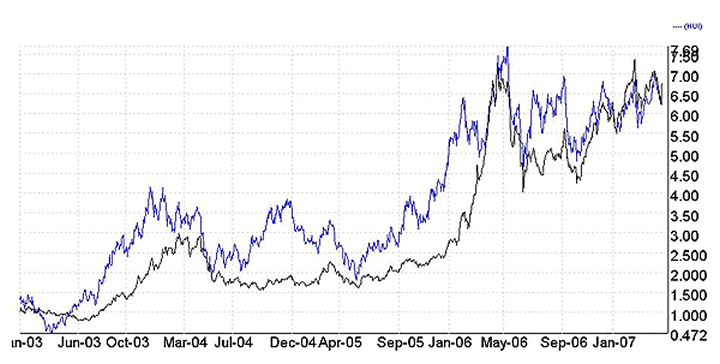
Is this seven-fold performance good, bad or indifferent compared to the general world of precious metal stocks? To answer that, we reproduce the graph with the HUI superimposed in blue. As it turns out over the same period, the HUI has increased about three fold at best. That is worse even than silver bullion itself but the HUI contains stocks more geared to the price of gold than silver hence the discrepancy. Also note that the two prices tend to correlate though the SASC is understandably more volatile.

The one question to be posed is whether the SASC has formed a double top based on the April 2006 and February 2007 peaks? Actually, the February 2007 high is higher than the May 2006 that may suggest a renewed bull but it is only about 1% higher so it is not the strong confirmation that we still seek for the silver stock bull market.
As I pondered this question while finishing my new Sixty Silver Stocks Mining Report (see blog for further details), another type of double was visible on the graph and that is the double bottom formed between June 2006 and October 2006. From that point onwards, the SASC has been on a tear increasing by 73% at its highest point.
The main thing to note is that not many people follow this SASC graph! It will be the chart formations in the hugely followed HUI and XAU charts that will sway investors as to whether to sell or buy and in that regard the HUI forms no double top but certainly forms a coinciding double bottom.
So the stage is set for a renewed surge in the silver stocks world. A bit of a correction is underway just now but be ready to complete your silver stock portfolios soon before the next big silver wave hits the financial shores!
By Roland Watson
http://silveranalyst.blogspot.com
Further analysis of the SLI indicator and more can be obtained by going to our silver blog at http://silveranalyst.blogspot.com where readers can obtain the first issue of The Silver Analyst free and learn about subscription details. Comments and questions are also invited via email to silveranalysis@yahoo.co.uk .
© 2005-2022 http://www.MarketOracle.co.uk - The Market Oracle is a FREE Daily Financial Markets Analysis & Forecasting online publication.


