Financials XLF ETF Coiled Pattern About to Break in Which Direction?
Stock-Markets / Banking Stocks May 28, 2009 - 02:05 PM GMTBy: Mike_Paulenoff
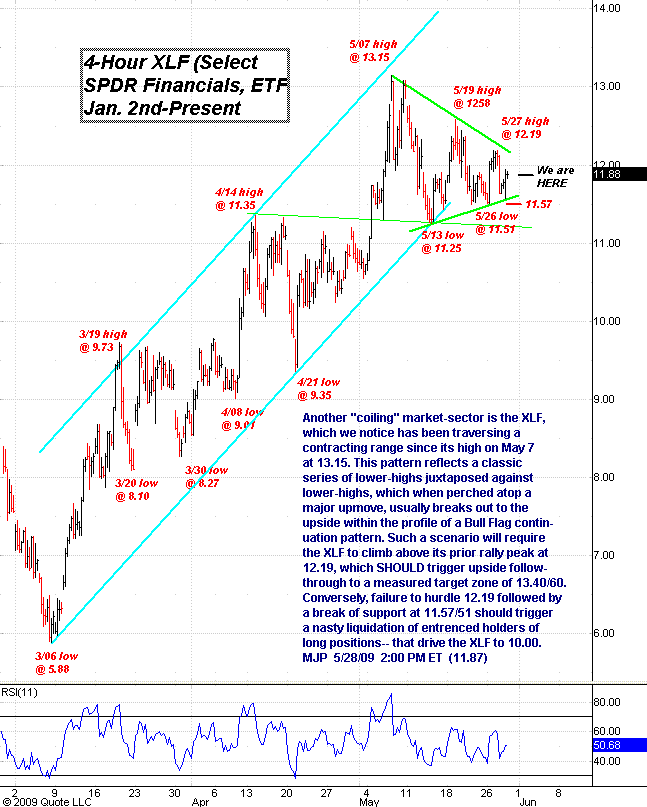
 I scan the various sector charts to see if any of them provide clues about the eventual directional breakout of the major equity market ETFs from "The May Coil" pattern. One “coiling” market is the Financial Select SPDR ETF (NYSE: XLF), which has been traversing a contracting range since its high on May 7 at 13.15. This pattern reflects a classic series of lower highs juxtaposed against higher lows, which when perched atop a major upmove usually breaks out to the upside within the profile of a bull flag continuation pattern.
Such a scenario will require the XLF to climb above its prior rally peak at 12.19, which should trigger upside follow-through to a measured target zone of 13.40/60. Conversely, failure to hurdle 12.19 followed by a break of support at 11.57/51 should trigger a nasty liquidation of entrenched holders of long positions – that drive the XLF to 10.00.

Sign up for a free 15-day trial to Mike's ETF Trading Diary today.
By Mike Paulenoff
Mike Paulenoff is author of the MPTrader.com (www.mptrader.com) , a real-time diary of Mike Paulenoff's trading ideas and technical chart analysis of
Exchange Traded Funds (ETFs) that track equity indices, metals, energy commodities, currencies, Treasuries, and other markets. It is for traders with a 3-30 day time horizon, who use the service for guidance on both specific trades as well as general market direction
© 2002-2009 MPTrader.com, an AdviceTrade publication. All rights reserved. Any publication, distribution, retransmission or reproduction of information or data contained on this Web site without written consent from MPTrader is prohibited. See our disclaimer.
Mike Paulenoff Archive |
© 2005-2022 http://www.MarketOracle.co.uk - The Market Oracle is a FREE Daily Financial Markets Analysis & Forecasting online publication.


