Banking Sector Index BKX at Critical Juncture
Stock-Markets / Stock Index Trading May 27, 2009 - 05:33 PM GMTBy: Marty_Chenard
 Institutional Investors have one special index that they look to when trying to measure the strength of the economy.
What's the Index and why do they favor it?
It is the S&P 500 because it is the index with the broadest array of sectors that give a clear composite view of economic conditions.
Take the Financials for example. They have been hit hard, have needed Government bailout money, and are more than likely over valuing their assets at this point. So this has been a sector in turmoil and because it is an important part of the S&P's makeup, it has an influence on the S&P's trending and strength.
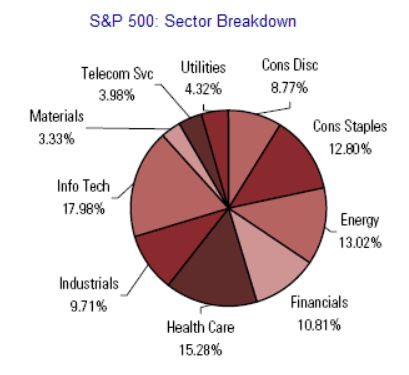
How much of the S&P 500 is made up of Financial stocks?
The answer: 10.81% (The percentage and breakdown of the other sectors can be seen on the chart below.)

Okay ... Financials are important relative to the action of the S&P 500.
What is the Banking Index doing now? (Symbol: $BKX)
Is it trending up or down?
Is it helping or hurting the S&P 500?
Is it at an important juncture now?
Here are the answers with the chart below:
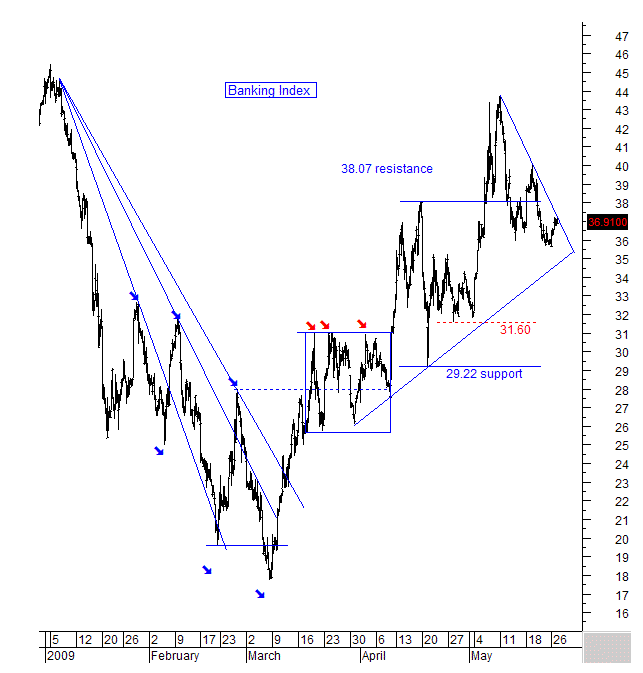
1. The Banking Index is trending up, so it is helping the S&P. It started its up trend the week of March 9th.
2. Is it at an important juncture now? The answer is yes as seen on the chart. Note that the Banking Index is showing a short term down movement, but that movement will soon be approaching a major support line.
More importantly, the pattern now is a triangular pattern. Note how the index has touched the upside resistance 3 times so far. In fact, the third (and current touch) shown was at 10 AM this morning.
What is clear about this hourly chart, is that the intersection of the resistance and support is close at hand.
It is at that point, that the Banking Index has to break out of the triangular pattern. When that happens, it will have an impact on the market and the S&P 500's direction.

*** Feel free to share this page with others by using the "Send this Page to a Friend" link below.
________________________________________________
*** Feel free to share this page with others by using the "Send this Page to a Friend" link below.
By Marty Chenard
http://www.stocktiming.com/
Please Note: We do not issue Buy or Sell timing recommendations on these Free daily update pages . I hope you understand, that in fairness, our Buy/Sell recommendations and advanced market Models are only available to our paid subscribers on a password required basis. Membership information
Marty Chenard is the Author and Teacher of two Seminar Courses on "Advanced Technical Analysis Investing", Mr. Chenard has been investing for over 30 years. In 2001 when the NASDAQ dropped 24.5%, his personal investment performance for the year was a gain of 57.428%. He is an Advanced Stock Market Technical Analyst that has developed his own proprietary analytical tools. As a result, he was out of the market two weeks before the 1987 Crash in the most recent Bear Market he faxed his Members in March 2000 telling them all to SELL. He is an advanced technical analyst and not an investment advisor, nor a securities broker.
Marty Chenard Archive |
© 2005-2022 http://www.MarketOracle.co.uk - The Market Oracle is a FREE Daily Financial Markets Analysis & Forecasting online publication.


