Interest Rate Flashing Strong Stock Market Sell Signals
Stock-Markets / Stocks Bear Market May 27, 2009 - 10:00 AM GMT Claus Vogt writes: One of the first lessons I learned in analyzing and forecasting the direction of the stock market was the extreme importance of interest rates. That’s because holding a stock gives you the right to part of a company’s future cash flow. And to determine the value of that cash flow back to today’s value, you need an accurate interest rate gauge.
Interest rates can also be seen as the price of money or capital. Price signals are the main drivers to achieve economic equilibrium, to adjust supply and demand, and finally to develop the productive structure of an economy. And the price of capital is the single most important price of all …
Every investment calculation depends on it, and so do all decisions between consumption and saving.
That’s why changes in interest rates are a major tool in my analytical tool box.
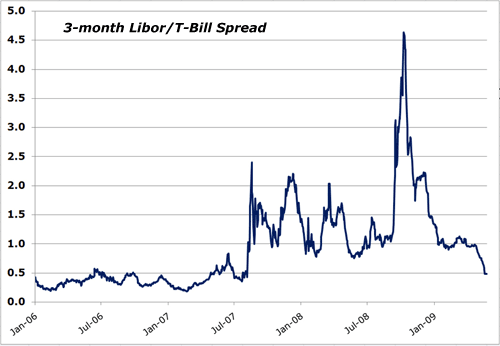
During the past two years, interest rate spreads between different risk classes of fixed-income securities gave relatively good early-warning signals for the developing banking and financial crisis.
As you can see in the chart below, during the height of the banking crises in 2008, risk spreads reached record levels. Since then, they have come down a lot, some almost to pre-crisis levels.

Source: Bloomberg
Many on Wall Street would have you believe that the declining spread means the crisis is indeed history. However, I see a very strong argument against their rosy prediction …
Market Interventions Destroy the Price Signals
Markets are information-processing mechanisms. Hence market prices bear important signals for market participants and analysts.
But this mechanism can only work in free, unhampered markets!
 |
| The Treasury and Fed are tinkering with the markets. This is distorting prices and causing the markets to give false signals. |
If someone tinkers with the markets and manipulates prices, the information-processing mechanism breaks down, and the market emits flawed signals.
And that’s exactly what the Fed and Treasury are doing with financial markets right now!
In guaranteeing so-called “too big to fail” market participants and manipulating prices via massive buyout programs, these markets are hugely distorted.
The prices coming from these manipulated markets are not reliable. They don’t tell much about the real health of the markets … they just tell us how successful the government is in temporarily fixing certain prices.
Treasury Bonds’ Yields Have Risen Conspicuously …
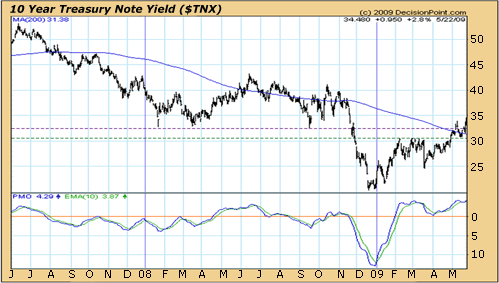
Since the end of December 2008, U.S. Treasury bond prices have declined, and yields have risen accordingly. For instance, the yield of 10-year Treasuries has risen from 2.04 percent on December 18, to 3.45 percent as of yesterday. You can see the ferocity of this interest rate rise in the chart below …

Source: www.decisionpoint.com
Interestingly, the Fed has started to buy Treasury bonds with longer maturities as a means of its “quantitative easing.” But in spite of the Fed’s efforts to hold down interest rates, the market isn’t cooperating. This clearly shows the limitations of a central bank.
Moreover, money printing along with a swelling government debt is poisonous for the health of the Treasury bond market. This is becoming common knowledge among investors. The only question seems to be when this common knowledge will start to matter. Regardless, in the end, markets are always stronger than bureaucrats.
Interest rates have risen strongly since December 2008. This is a bad omen for the stock market. In fact, there’s even a whole set of stock market indicators based upon interest rates. Now, after five months of rising rates, these indicators have started flashing warning signs for the stock market …
The Stock Market Risk Is Very High … Again
The stock market rallied strongly off its March lows. Yet market internals were weak all the way up — especially volume — and they’ve only gotten weaker during the past days.
Momentum indicators are extremely overbought and rolling over, thus giving sell signals …
 |
| The bulls may have given the market a strong boost. But momentum indicators are extremely overbought and rolling over, thus giving sell signals. |
Sentiment indicators are showing too many bulls, which means there are few people left to buy into this rally …
The chart pattern is a bearish wedge, and price has already broken the lower boundary of this formation …
Price-to-earnings ratios have reached an extremely high 59.6 for the S&P 500 and 36 for the NASDAQ 100 …
And economists are strongly betting on “green shoots” growing into something very positive soon … a forecast based on hope and few facts.
Now … with important interest-rate-sensitive indicators adding to this already bleak picture, I see a high likelihood that this huge bear market rally is coming to an end. So I suggest you make sure you are prepared!
Best wishes,
Claus
This investment news is brought to you by Money and Markets . Money and Markets is a free daily investment newsletter from Martin D. Weiss and Weiss Research analysts offering the latest investing news and financial insights for the stock market, including tips and advice on investing in gold, energy and oil. Dr. Weiss is a leader in the fields of investing, interest rates, financial safety and economic forecasting. To view archives or subscribe, visit http://www.moneyandmarkets.com .
Money and Markets Archive |
© 2005-2022 http://www.MarketOracle.co.uk - The Market Oracle is a FREE Daily Financial Markets Analysis & Forecasting online publication.


