Going Ballistic: The Hard Facts about Parabolic Spikes Such as China's Stock Market
Stock-Markets / Chinese Stock Market May 23, 2007 - 03:33 PM GMTBy: Doug_Wakefield
Living through a mania is supposed to be a once in a lifetime event. For example, the French, who lived through the implosion of the Mississippi Scheme, and the English, who lived the South Sea Bubble collapse in the 1720s, did not see the same parabolic rises again during their lifetimes. Or for a more recent example, consider the parabolic rise of the Nikkei to its all time high in 1989, the aftermath of which has since changed the disposition of the Japanese toward their stock market. As we mentioned in The Nikkei: Raiders of the Lost Ark , Japanese nationals have a different view of their stock market than foreign hedge fund managers.
“Although there is a problem in that its [ Japan 's] stock market is supported primarily by foreign investors, Japanese nationals make up 95% of its government bond market." 1
And yet, while the NASDAQ is still valued at less than 50 percent of what it was seven years ago, investors seem more than willing to get in or stay in “for the long term.” For those, like us, who “can't see the collective wisdom of the market,” who think that things like debt, sharply falling retail sales, sharply falling housing sales, and wars with no end matter, we need to get over our worries and realize that the Dow is going up and that nothing else matters but... price. After all, the Dow is hitting all time highs, and if we missed out on its 13 percent, 1600-point rise over the last ten weeks, we must be fools. There's no time to ask questions – just fire the trader, manager, or newsletter that does not “get it,” and move on. As in all credit induced manias, at the end of the day the only thing that matters is recent – and I do mean recent – performance.
Jeremy Grantham explained this mindset in his recent quarterly letter to his institutional clients:
“The more leverage you take, the better you do; the better you do, the more leverage you take. A critical part of a bubble is the reinforcement you get for your very optimistic view from those around you.” 2
As all true contrarians know, this is when making decisions opposite of the herd is the hardest, and yet, as history has shown, this is when it often proves most rewarding. So let's look at three variables that all investors should be evaluating right now to resist the siren's song of higher equity prices as we pass through this ever-rising sea of debt.
Parabolic Rises: Lessons from 2004 to 2006
In June of 2004, we released Special Edition: Parabolic Rises with this chart, produced by Elliot Wave International, clearly revealing a parabolic spike in the price of silver.
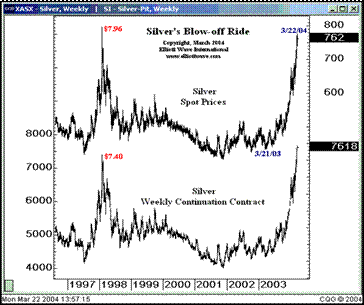
As the chart below shows, after hitting $8.50 two weeks later, silver dropped 36 percent in just five weeks to $5.45, and would not surpass its previous high until December of 2005.
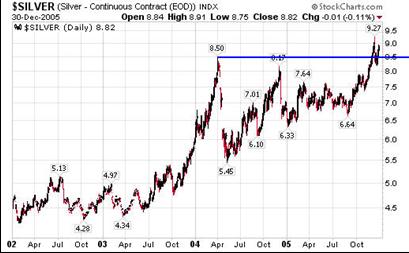
Then, in another parabolic move silver went to $15.21 into May 11 th of 2006. It then decline 38 percent in a little over four weeks, and has not reached that price since.
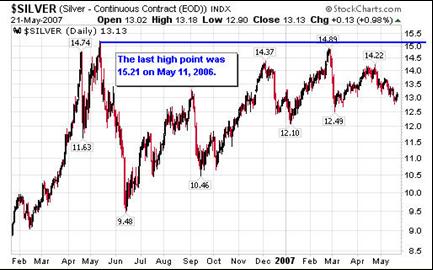
Now, don't get me wrong – this is not about bashing silver. Frankly, right now, I can see some compelling arguments for being long or short silver.
The main purpose of these charts is to show that when the price of anything goes parabolic, even though it's fun to run to your computer screen every day, it is a clear warning to employ contrarian thinking and resources. Bullishness has run to extremes and price levels could experience a sharp enough downdraft to warrant severe caution.
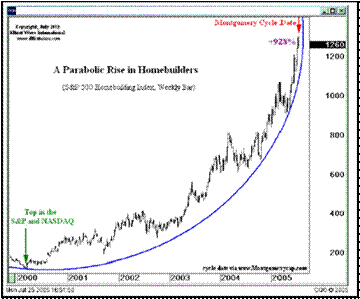
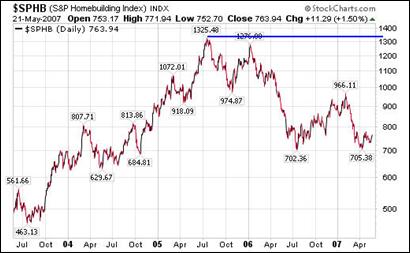
In July of 2005 we released a newsletter called Teenage Investing, displaying a number of charts and pictures from a wide variety of sources. As you can see above, the parabolic rise in housing stock was clearly unsustainable. After topping at 1325 on July 20 th of 2005, the index fell 47 percent to 702 one year later, and currently trades around 765.
Parabolic Rises: A Look at 2007
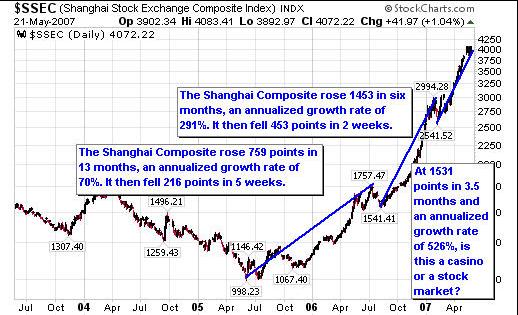
So, what parabolic rises today tell investors that markets could change violently? The Shanghai Stock Exchange in China would certainly qualify. Since the middle of 2005, its annualized rate of growth has increased from 70 to 291 to 526 percent! Clearly, unsustainable.
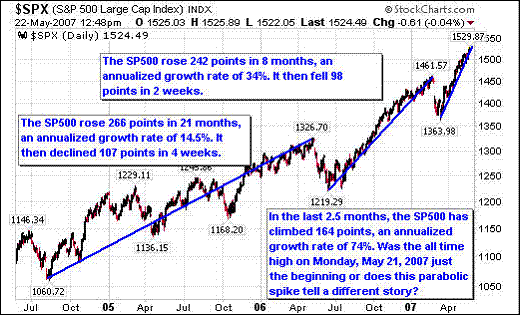
And though its growth is dwarfed by the Shanghai , the S&P500 has begun to move in parabolic form. As shown below, its annualized growth rate has gone from 14 ½ to 34 to 74 percent annually. Sustainable? We think not.
And as these rises are taking shape, rather than address the unsustainable nature of parabolas, many bearish advisors believe that as long as the Fed inflates the money supply, which is currently growing at an annualized pace of 13 percent , this flood of credit will continue to drive up equity prices.
Yet, history and science show that nothing could be further from the truth. For example, on April 16 th Greg Weldon, of Weldon's Money Monitor , cited a report from the People's Bank of China revealing the largest growth of commercial lending in China 's history. In the fourth quarter of 2006 China 's commercial loan volume was 425 billion Yuan. During the first quarter of 2007, it topped 1, 423 billion Yuan, a 335 percent increase in 90 days! How likely is this performance to repeat for several more quarters?
You see, just like the housing market, eventually bubbles grow so large that they require enormous reserves just to maintain their current shape. They become so large that they are unable to grow, much less grow at their previous astronomical rate. For those who doubt, I ask, how much would the dollar need to depreciate and inflation need to rise to move the Dow to 20 or 30 thousand? How much of a decline in consumer savings or a rise in housing prices and a decline in inventory would it take to bolster retail or auto sales? At some point, the stress on the system will become too great and a rapid reversal will begin.
The Black Swan
In his new book, The Black Swan, Nassim Nicholas Taleb expands on a concept he addressed in his first book, Fooled by Randomness. In the opening, Taleb addresses three attributes of the Black Swan:
“First, it is an outlier, as it lies outside the realm of regular expectations, because nothing in the past can convincingly point to its possibility. Second, it carries an extreme impact. Third, in spite of its outlier status, human nature makes us concoct explanations for its occurrence after the fact, making it explainable and predictable.” 3
And when we understand this concept, we realize why anticipating the rare event is critical, and that any model that does not address this risk is dangerously incomplete. Parabolic rises contain within themselves the warning of a price breakdown. As such, I strongly encourage you to help your clients and friends to stop extrapolating our current conditions into the indefinite future, and to stop repeating the phrase, “Well you have been saying that the markets were going to decline for a long time, and nothing has happened yet.” The real science of price movement and the pragmatic restrictions of debt overhang reveal the fallacy of such a mindset. But, emotions can cloud our judgment and make us rationalize the most reckless of actions.
Sources:
• Balance Sheet Recession: Japan 's Struggle with Uncharted Economics and its Global Implications (2003), Richard Koo, page 73
• GMO Quarterly letter, “It's Everywhere, In Everything: The First Truly Global Bubble,” April 2007, Jeremy Grantham
• The Black Swan: The Impact of the Highly Improbable (2007), Nicholas Taleb, pages xvii & xviii
Since January 2006, Best Minds Inc has developed 15 lessons to date, through our monthly newsletter, The Investors Mind: Anticipating Trends through the Lens of History, with the intent of clarifying and strengthening the thinking of investors and those in positions of leadership. If you are interested in an overview of the 15 lessons that we have presented to our subscribers, click here . We continue to gain recognition for our industry paper on short selling, Riders on the Storm: Short Selling in Contrary Winds . The research paper can be obtained with a subscription to The Investor's Mind. To learn more about our mission, as well as our educational and advisory services, visit our website .
By Doug Wakefield with Ben Hill
Doug Wakefield,
President
Best Minds Inc. , A Registered Investment Advisor
Copyright © 2005-2007 Best Minds Inc.
Best Minds, Inc is a registered investment advisor that looks to the best minds in the world of finance and economics to seek a direction for our clients. To be a true advocate to our clients, we have found it necessary to go well beyond the norms in financial planning today. We are avid readers. In our study of the markets, we research general history, financial and economic history, fundamental and technical analysis, and mass and individual psychology.
© 2005-2022 http://www.MarketOracle.co.uk - The Market Oracle is a FREE Daily Financial Markets Analysis & Forecasting online publication.


