Timing of the Next Stocks Bear Market Primary Down Leg
Stock-Markets / Stocks Bear Market May 20, 2009 - 03:34 AM GMTBy: Brian_Bloom
 In summary, it looks like the current upward technical reaction in the Primary Bear Market can be expected to suck more investors into the markets for another couple of months. Within 3 to 6 months from now the equity markets seem likely to resume their Primary Bear Trend.
This morning, when I was scrolling through the charts trying to get a feel for the mood of the market, I constructed the chart below (courtesy stockcharts.com):
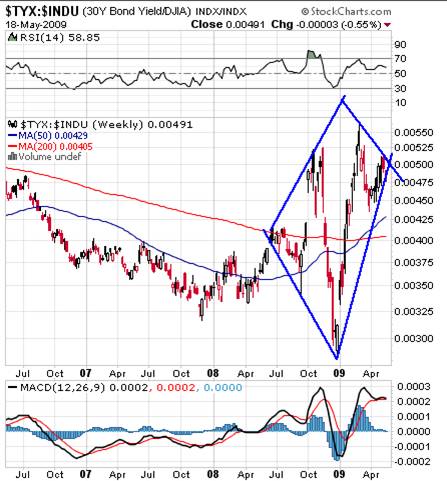
This chart is a pictorial representation of the ratio of the 30 year US bond yield divided by the Dow Jones Industrial Index.
My underlying logic was this:
- The ratio should rise if interest rates rise and the market should fall to compensate given that dividend yields are (should be) benchmarked against bond yields.
- Alternatively, if the ratio falls, it will imply that the equity markets are getting stronger relative to interest rates (or rates are weakening relative to the equity indices – which will rise as a result of falling interest rates)
Arguably, the trend lines which have been drawn in are evidencing a diamond formation as represented by the four blue trend lines. Although this is not a “typical” diamond, we should bear in mind that the last few months have been unusually volatile.
Now, there’s no question that the ratio will eventually have to break either up or down from this pattern. Either it will penetrate the falling trend line to the upside, or it will penetrate the rising trend line to the downside.
This presented a conundrum: Will the price break up or down?
- Based on the MACD oscillator pattern the ratio should break down from the diamond formation.
- Whilst it is “sometimes” a continuation pattern, a diamond pattern is “typically” a reversal pattern. If it is a reversal pattern, the ratio should break up.
Thinking about this conundrum, I came to the conclusion that there is another possibility: The upward sloping trend line on the right hand side of the chart seems to me to be too steep. Again, typically, a diamond formation has roughly parallel outer boundaries. Just for the hell of it, I drew in an imaginary trend line which would be more consistent with what the text books would expect.
This is what it would look like:
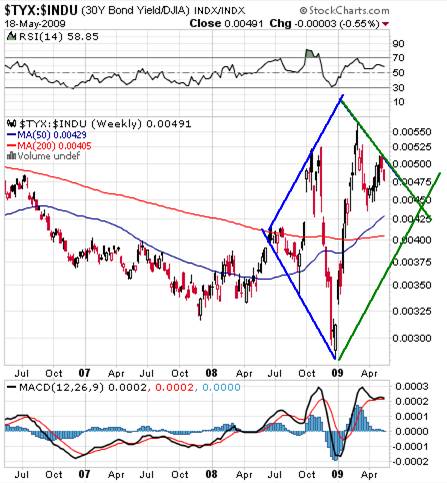
The message that emerges is this:
If the ratio continues to move within the boundaries of the diamond for up to six months, then this would allow the MACD oscillator to behave “normally”. Logically, at the point where the oscillator became oversold and turned up again (6-12 weeks time), the associated ratio value would represent a more technically acceptable support point which would allow the rising trend line to be drawn in a manner that would be more consistent with technical analysis expectations. If this happens then, after it turns up again, the ratio would encounter the resistance of the falling green trend line once again.
At that point, if the ratio were to break up, it would be consistent with the technical expectations associated with a diamond reversal pattern. From a fundamental perspective, a break up from the diamond at that time would probably be accompanied by rising yields and falling prices – which would be consistent with expectations based on values.
Of course, there are a lot of “ifs” here, but one fact is unarguable: The US equity market is dramatically overvalued in terms of historical norms – as can be seen from the chart below (courtesy DecisionPoint.com)
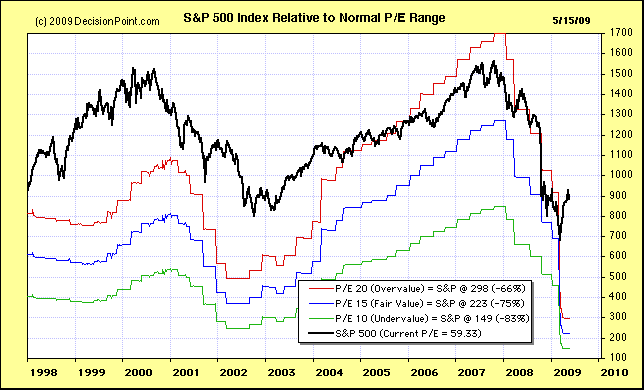
As at the week ended May 15th 2009, the Price/Earnings ratio for the Standard and Poor 500 Industrial Index (with 12 months trailing earnings adjusted for Generally Accepted Accounting Principles) was 59.33X.
What this means is that, at current earnings, it will take 59.33 years to recover your capital if you invest in the equity market today.
Of course, with companies announcing losses that are “not as bad as expected” and with “green shoots” popping up all over the place, corporate earnings may be expected to rise from current levels.
But will they triple? Because they will need to triple in order for the P/E ratio to fall from 59.33X to an overvalued level of 20X assuming the S&P Index remained at or near its current lofty level.
Of course, anything is possible, but reasonable people conduct their affairs based on a balance of probabilities.
The question a reasonable person needs to ask is this: On a balance of probabilities – and given the fact that unemployment is still rising in an economy in which 70% of the GDP is dependent on consumers continuing to consume at the same historically profligate levels – is it reasonable to expect corporate earnings to triple within the next (say) two years?
Conclusion
Based on the natural ebb and flow of pessimism and optimism with the markets, and based on underlying values, it appears that what we are currently experiencing within the equity markets is a technical upward reaction within a Primary Bear market. Based on the P/E chart above, the most logical way for P/E ratios to normalize would be for equity prices to fall even as underlying profits rise modestly from extraordinarily low levels. Based on the relative strength chart in which the green “hypothetical” trend lines have been drawn, the timing of the commencement of the next down leg of the Primary Bear market will probably be no later than 3-6 months away.
Author’s note
US public debt has risen from $9.36 trillion to $11.28 trillion – or by over $1.9 trillion in the past year. (source: http://www.treasurydirect.gov/NP/NPGateway ) This occurred because it was more comfortable for our politicians to embrace the economic theories of Lord Keynes than those of the Austrian school of economics.
But the world does not revolve around the theories of economists – regardless of how brilliant they might be. If we look beyond the subject of theoretical economics and back across the pages of history, we discover the basic common sense principle that human progress requires various types of endeavor and endeavor requires work and work requires energy input. By way of illustration, against this energy yardstick we stand in awe and we wonder in amazement: What energy technologies were applied to build the Egyptian pyramids and other ancient megalithic buildings? Even in today’s world we would experience extreme technical difficulties in quarrying, transporting and lifting even one (say) 70 ton slab of stone. Some say it would be require an impossible combination of brute force and precision engineering even in this day and age to build the Pyramid of Giza, as an example. In the context of economics, one might think of the building of this pyramid as a massive infrastructure development, but the primary condition precedent to building it was not “affordability” it was “appropriate technology backed by extraordinary amounts of energy”.
Clearly, it is energy that drives the world economy, not money. However, the shoot-from-the-hip reaction of the politicians and central bankers to the recent financial implosion has not been targeted with any precision at the energy markets. Furthermore, thanks to another politician, Mr. Al Gore, the primary sources of the artificial energy which fueled the industrial revolution from the mid 18th century to the turn of the 21st century, viz fossil fuels, have become pariahs because of the “CO2-causes-global warming” argument which he has been promoting.
With all this in mind, the Western world’s politicians should have been applying their countries’ meager financial resources to funding the investigation, development and support of alternative, clean sources of energy in a much more enthusiastic, focused and urgent manner than they have done. That would have been a highly constructive approach. Arguably, (by way of one example) it would have been far more sensible to pursue this latter course of action than to throw mountains of money at AIG which, in turn, was able to protect Goldman Sachs from losses that flowed from erroneous policies. In a normal Darwinian world, the fittest survive and those who make life threatening mistakes are eliminated by the forces of nature, not rewarded for these mistakes.
Unfortunately, “crony politics” was only part of the problem. Another part of the problem revolved around self-centered greed on the part of those who are suppliers of the fossil fuels such as coal and oil – whose interests were being protected by the political leaders of those countries which refused the ratify the Kyoto protocols for a decade following 1997. Furthermore, these particular political leaders were not the only ones taking self-centered decisions and/or action. Here is a chart reproduced from the monthly OPEC report of May 2009:
http://www.opec.org/home/Monthly%20Oil%20Market%20Reports/2009/pdf/MR052009.pdf
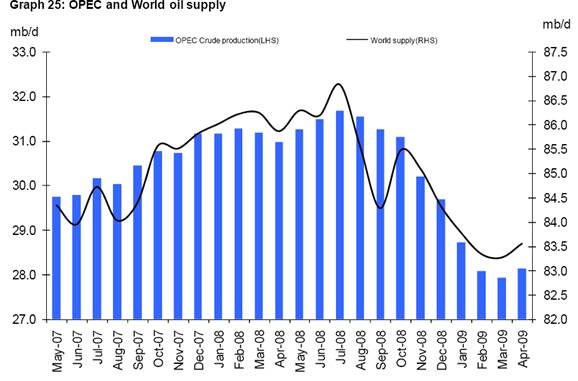
There are some who are arguing that the OPEC oil producing nations are deliberately curtailing production in order to “force” up the price of oil.
In fact they may be correct. According to the chart below, the price of oil began to rise in early March. It was more likely an absence of supply that caused the price rise as opposed to a presence of demand (short covering demand aside)
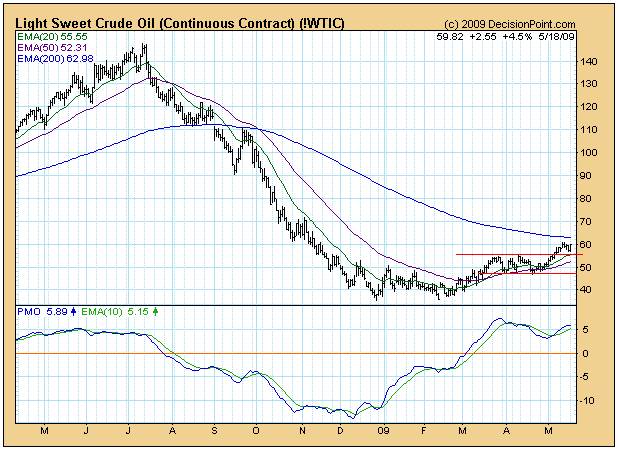
Unfortunately, again, any economics 101 student can understand that when prices rise, volume falls. Whilst curtailing the output of oil will likely cause the price to rise, the rising price will also curtail the amount of oil consumed. And, for oil, let’s substitute the word “energy”.
The actions of OPEC are virtually guaranteed to act as a brake on the resurgence (if any) of industrial and/or transport activities which drive the economy. In particular, one should bear in mind that over 90% of all the transport modalities within the USA are dependent on oil.
All of the above leads to the unavoidable conclusion that the problems which beset humanity cannot be solved one at a time and in a vacuum, isolated from each other. What is required is a holistic, overview approach. That is what my recently published novel, Beyond Neanderthal, attempts to do. Through the medium of its light hearted storyline it attempts to put some perspective on the “true” causes of the various issues which confront us; and it attempts to demonstrate how all these drivers of social behavior are interlinked. The problems which confront us are soluble. But they can only be solved if they are understood from a broad, holistic perspective. Unfortunately, politicians tend not to think holistically. At best, they think parochially. At worst, they think selfishly.
So, with this in mind, what do we do? Well, let’s put it this way: If this dysfunctional attitude of our political leaders does not change – and soon – there may not be another opportunity to think holistically. If the market turns south within the next 3-6 months, it is unlikely that there will be sufficient financial resources available to fund the activities needed to develop the alternative sources of energy and commercialize them across the planet. Whilst solar, wind, ocean wave, geothermal, hydrogen and even nuclear energy have some positive attributes none of them will ever – by itself – fully replace fossil fuels. Further, so-called “biofuels” are nothing other than a disguised version of fossil fuels. From a holistic perspective, private enterprise cannot be expected to solve the interlinking matrix of challenges which society faces on a global level.
The time has come for the grass roots public to make its collective voice heard. We need to be prodding our politicians in the direction of where they should be focusing their attention. In principle, there are three attitudinal changes required in their thinking:
- They need to focus far more attention on finding replacement/s for the core energy drivers of all human endeavor, namely fossil fuel derived energy.
- They need to work in a coordinated manner against an articulated plan of action which has nominated benchmarks of achievement; and timelines.
- All alternative energies need to be investigated; even those that seem, at face value, to be technically impossible. In particular, the claims of over-unity electromagnetic energy technologies need to be investigated in a disciplined manner. In context of the seriousness of the collective challenges which are manifesting, there is no room for dogmatism on the part of our scientific community. Could it have been so-called “over-unity” electromagnetic energy technology which facilitated the building of the pyramids? Well, unless we investigate the modern day claims in a disciplined manner, we might never know for certain
By Brian Bloom
Beyond Neanderthal is a novel with a light hearted and entertaining fictional storyline; and with carefully researched, fact based themes. In Chapter 1 (written over a year ago) the current financial turmoil is anticipated. The rest of the 430 page novel focuses on the probable causes of this turmoil and what we might do to dig ourselves out of the quagmire we now find ourselves in. The core issue is “energy”, and the story leads the reader step-by-step on one possible path which might point a way forward. Gold plays a pivotal role in our future – not as a currency, but as a commodity with unique physical characteristics that can be harnessed to humanity's benefit. Until the current market collapse, there would have been many who questioned the validity of the arguments in Beyond Neanderthal. Now the evidence is too stark to ignore. This is a book that needs to be read by large numbers of people to make a difference. It can be ordered over the internet via www.beyondneanderthal.com
Copyright © 2009 Brian Bloom - All Rights Reserved
Disclaimer: The above is a matter of opinion provided for general information purposes only and is not intended as investment advice. Information and analysis above are derived from sources and utilising methods believed to be reliable, but we cannot accept responsibility for any losses you may incur as a result of this analysis. Individuals should consult with their personal financial advisors.
Brian Bloom Archive |
© 2005-2022 http://www.MarketOracle.co.uk - The Market Oracle is a FREE Daily Financial Markets Analysis & Forecasting online publication.


