


Stock Market Trading In Between Support...
Stock-Markets / Stock Index Trading May 17, 2009 - 02:37 PM GMTBy: Jack_Steiman

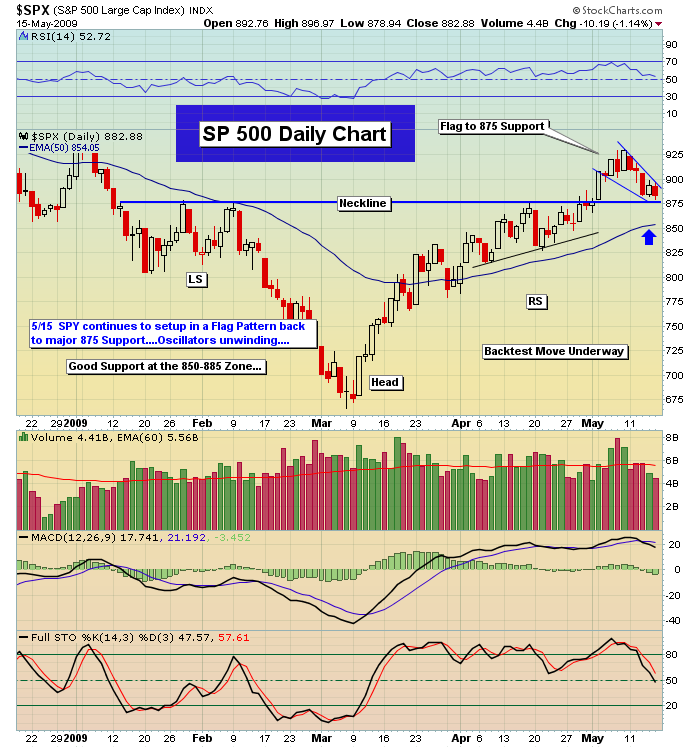
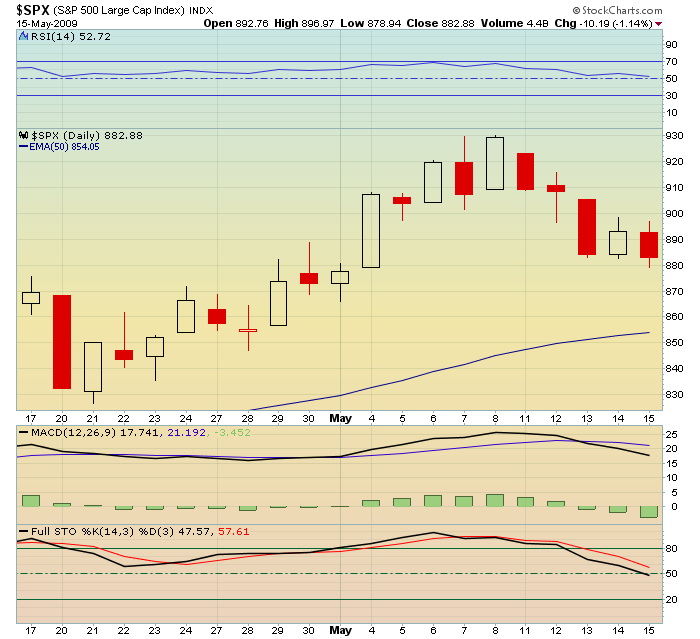
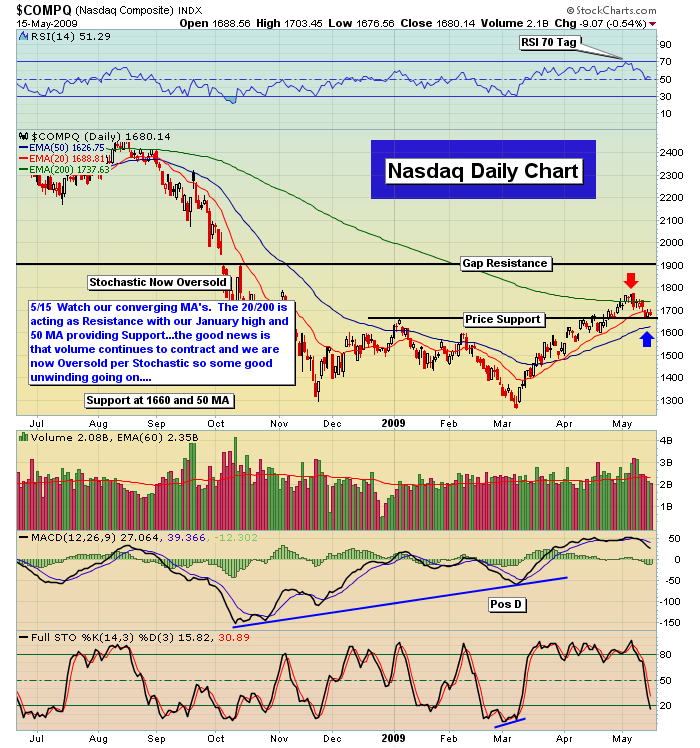
 A week of selling came our way and it had a good side to it if you're a bull. Selling never feels good, but you have to look deeper than just price to see if what took place during that selling possibly gives us something to get hopeful about. Again, that's if you're near-term bullish only. The bears will want to see if the selling is the start of something bigger for them and will look deeply inside the numbers for the week to see if their hopes will soon be put in to motion as well. The week started out with most of the index charts and just about every leadership stock chart on high poles and very overbought at 918 gap resistance. We were able to get a bit higher than that level but the overbought extremes would not allow the market to make a deeper move to the upside. we started to gradually pull back and we warned of a test of the recent breakout at 875.
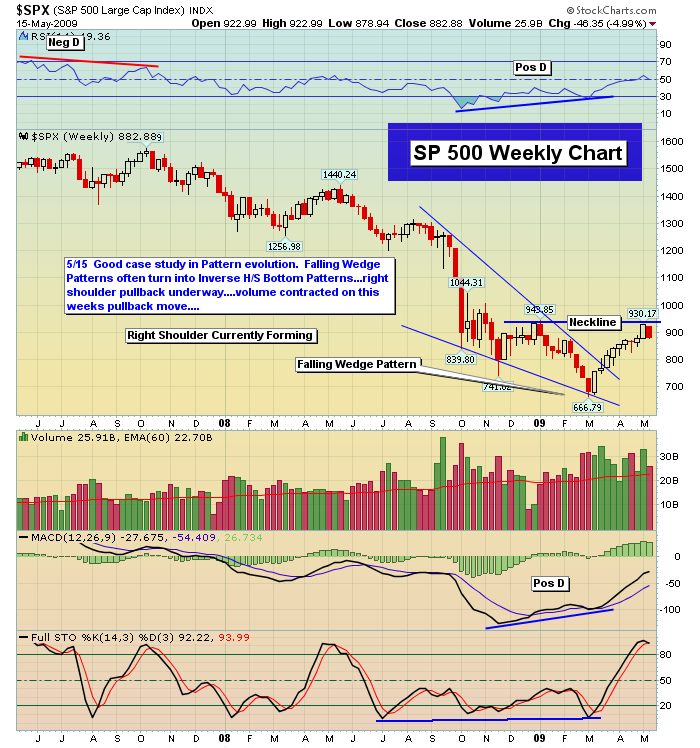
We got within three points of that level just before the close of action today. As we got there we started to see some very strong divergences set up on all of the shorter term time frame charts. Those being the 15's, 30's and 60's. The daily's are now oversold as are all of the short term time frame charts. This combination of events should allow the market to try another move higher as the week moves along next week. Certainly shorting at oversold on all time frame charts with positive divergences makes little to no sense whatsoever. Any move lower early in the week, should that take place, would only set the divergences up deeper and take oversold in to deeper levels of oversold so we should head higher some time early in the coming week.
When looking at the market I like to look deeper into those internals, especially when we're headed down such as we did this week. We noticed this week that the volume contracted quite a bit the lower the averages went. The advance decline line, although negative, held up much better than one might think possible. The advance decline line was spectacular on the rally but nothing terrible on the selling. The Macd's have unwound on all the time frame charts, especially the shorter time frame charts and that's good to see. The rsi's and stochastic's also unwound beautifully across the board thus the internals were quite good. Nothing bearish came from any of the selling. A lot of unwinding but no price damage to the overall recent up trend. If things were to change in terms of volume while at the same time losing critical support, then the red flag is up big time and we have change our way of approaching the market near term. For now, no red flags to be found even though we sold decently for the week.
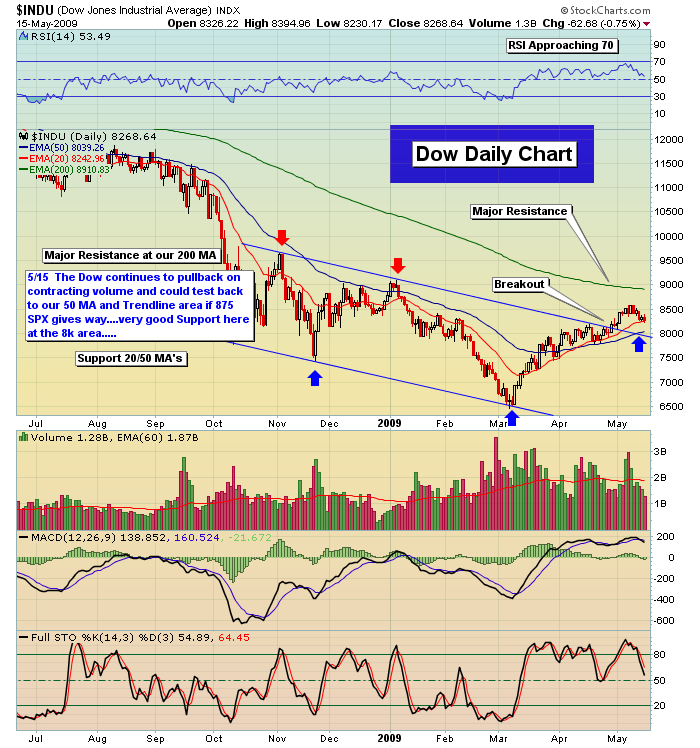
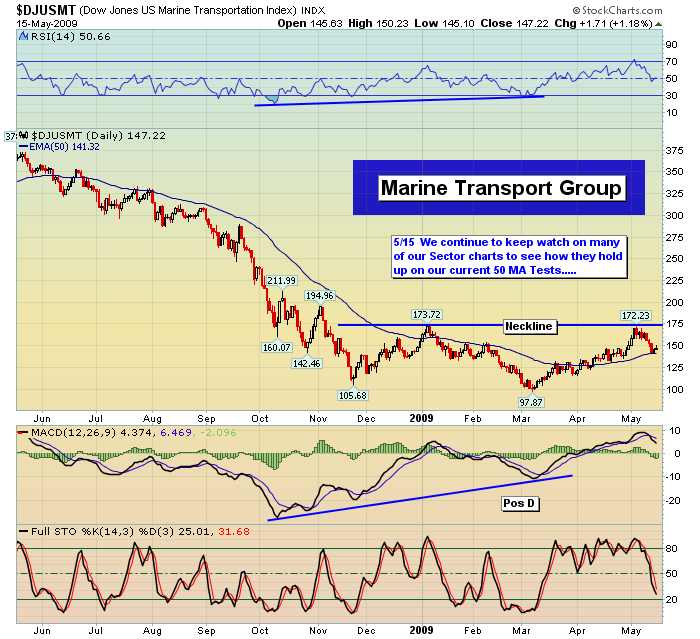
When you get a week of selling overall, you want to go to the leadership sectors of the market and then to the leadership stocks of those sectors and see what their charts look like. That they hold on to their overall bullish pattern. That they didn't start to crack or have too much volume come in. We can see across the board in sectors such as the financial's, technology and commodities that nothing broke thesis. While the selling didn't feel good, it never does if you're a bull, nothing really broke. There are back tests going on. there are 50 day tests and gap tests but nothing has broken below where they should. Some sold worse than others such as transports but it was up on such a high pole you can't really give too much energy to how far it sold off for it did not break where it should either. Leaders such as Apple (AAPL), Research in Motion (RIMM), Google (GOOG) and others certainly sold off but you can see on their charts that nothing terrible has taken place technically. You have to always keep your eye on the leaders for if they break, the market is almost sure to follow. So far we see nothing bad.
The Vix and Vxn continue their breakdown dance. It has been quite a move for those two and naturally the market has follow with its inverse action relative to the downward spiral in those issues. They are broken and can and surely will always bounce, but until they can break back out over critical resistance, you have to think of them as being a good indicator that the market should want to try higher prices again sooner than later. Often ,when indicators like these have massive rarely unseen spikes, that can often mean they will react to the opposite over time and break down further than many thought possible.
The spike or level of fear was simply so incredible, rarely if ever seen before, that things unwound very rapidly. Once unwound, it can be quite normal for them to stay unwound for a lot longer than most think it will. Just too much fear at one moment in time. Unsustainable and thus the incredible move back down that just doesn't seem interested in running back up again. it may go quite a bit lower over time but that story is clearly unwritten for now.
So where are we? We're in between support at 875 down to the 50 day exponential moving average at 852 and resistance up at 1697 or the gap down from the neckline earlier this week. When you're in between, and if things are still set up bullish as we think they are, you use weakness or appropriate set ups to buy stocks. This is how we're approaching the market right now. Many stocks are testing back to support at gaps or important moving averages as their oscillators unwind. We go one day at a time and stay with the trend in place until something unexpected occurs or set ups to change our minds.
By Jack Steiman
Jack Steiman is author of SwingTradeOnline.com ( www.swingtradeonline.com ). Former columnist for TheStreet.com, Jack is renowned for calling major shifts in the market, including the market bottom in mid-2002 and the market top in October 2007.
Sign up for a Free 30-Day Trial to SwingTradeOnline.com!
© 2009 SwingTradeOnline.com
Mr. Steiman's commentaries and index analysis represent his own opinions and should not be relied upon for purposes of effecting securities transactions or other investing strategies, nor should they be construed as an offer or solicitation of an offer to sell or buy any security. You should not interpret Mr. Steiman's opinions as constituting investment advice. Trades mentioned on the site are hypothetical, not actual, positions.
Jack Steiman Archive |
© 2005-2022 http://www.MarketOracle.co.uk - The Market Oracle is a FREE Daily Financial Markets Analysis & Forecasting online publication.