


Stock Market Investor Sentiment: Is More Bulls A Good Thing?
Stock-Markets / Stock Market Sentiment May 17, 2009 - 02:28 PM GMTBy: Guy_Lerner

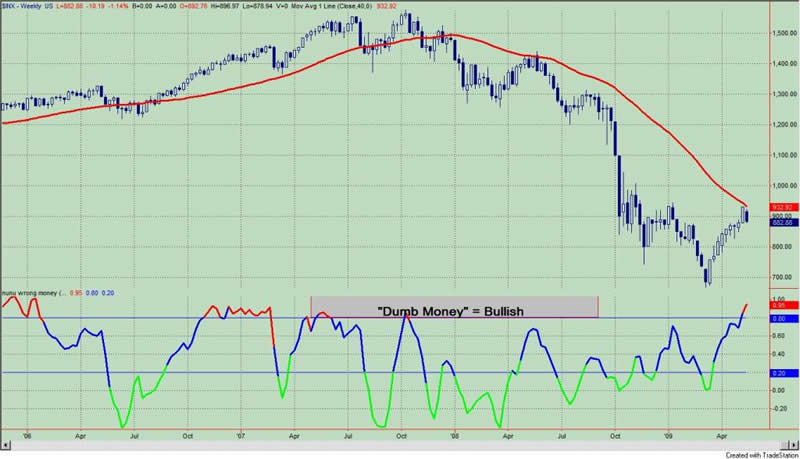
 Although the S&P500 lost 4.9% for the week, the bullish contingent actually grew stronger. This can be seen in the "Dumb Money" indicator shown in figure 1. The "Dumb Money" indicator looks for extremes in the data from 4 different groups of investors who historically have been wrong on the market: 1) Investor Intelligence; 2) Market Vane; 3) American Association of Individual Investors; and 4) the put call ratio.
Figure 1. "Dumb Money"/ weekly
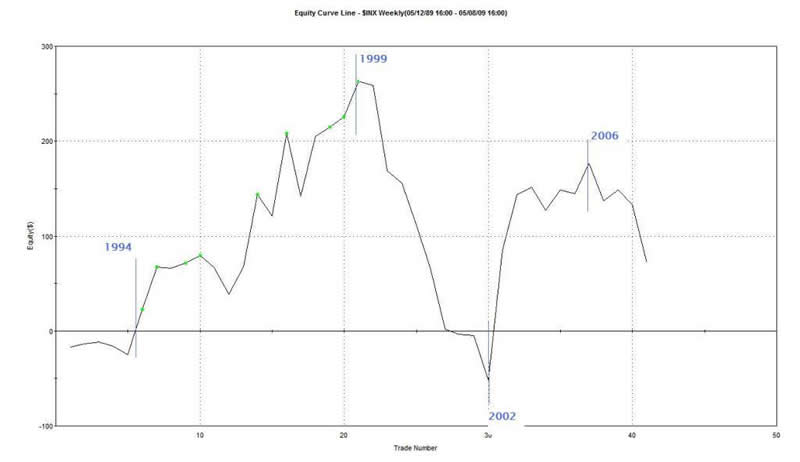
As pointed out last week, it takes bulls to make a bull market, and during a certified, bonafide bull market typically that is what you have - lots of bullish sentiment. This notion seemed to be bourne out by the strategy where you "bought" the S&P500 when the "Dumb Money" indicator was only in extreme bullish territory as it is now. As can be seen in the strategy's equity curve (which I showed last week), such a strategy only made money during a bull market. See figure 2.
Figure 2. Equity Curve
So maybe more bulls is a good thing?
But here we are one week after the initial signal and the S&P500 is down 4.99%. Does the "dumb money" have this one right? Was last week one gigantic head fake? To answer these questions, we need to look at each individual trade from our strategy.
Figure 3 is a maximum adverse excursion (MAE) graph showing each individual trade from the strategy. What does MAE measure? If you are like most traders or investors, you put on a trade and then watch as prices move adverse to your position as no one ever buys the exact low tick. MAE measures, in percentage terms, how much you had to lose before the position was closed out for a win or a loss. Look at the caret in figure 3 with the blue box around it. This caret represents one trade. This trade lost 2.25% (x-axis) before being closed out for a winner of 5.5% (y-axis). We know the trade is a winner because the caret is green.
Figure 3. MAE Graph
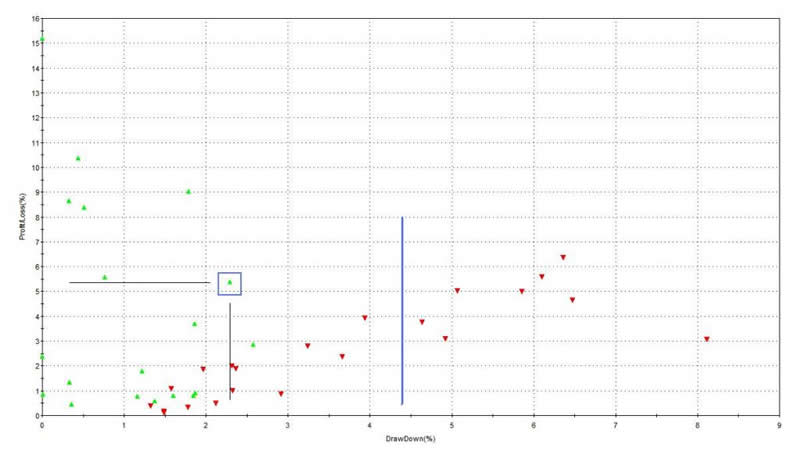
Now focus your attention to the right of the blue vertical line. Here we have 8 trades and they are all red carets (i.e., losing trades). The MAE for each of these trades was greater than 4.5%, and the MAE for the current trade is already 4.99%. In other words, the current trade is unlikely to be a winner as long as the "dumb money" remains this bullish. In fact, with 5 of the 8 trades losing greater than 4.5%, there is a possibility that the trade may not recover at all.
So how do we make the "dumb money" less bullish? Lower prices, of course.
Last week, I was unable to discern the significance of "too many" bulls. With this week's down draft, we have more information, and it seems unlikely that the equity markets are at the cusp of a new bull run as long as sentiment stays this bullish. Therefore, I am expecting lower prices over the next couple of weeks. This is another way of saying that the market will need to convert some of those bulls to bears before prices can move appreciably higher.
Furthermore, this view is also consistent with my belief that this is not the "technical" launching pad for a new bull market. I have summarized this research in the article "Bear Market Rally or New Bull?"
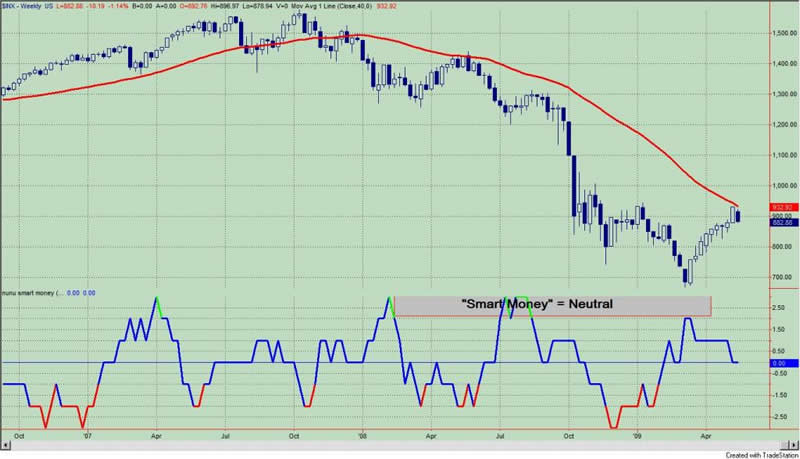
For the record, the "Smart Money" indicator is shown in figure 4. The "smart money" indicator is a composite of the following data: 1) public to specialist short ratio; 2) specialist short to total short ratio; 3) SP100 option traders. There is no change in the "smart money" this week.
Figure 4. "Smart Money"/ weekly
By Guy Lerner
http://thetechnicaltakedotcom.blogspot.com/
Guy M. Lerner, MD is the founder of ARL Advisers, LLC and managing partner of ARL Investment Partners, L.P. Dr. Lerner utilizes a research driven approach to determine those factors which lead to sustainable moves in the markets. He has developed many proprietary tools and trading models in his quest to outperform. Over the past four years, Lerner has shared his innovative approach with the readers of RealMoney.com and TheStreet.com as a featured columnist. He has been a regular guest on the Money Man Radio Show, DEX-TV, routinely published in the some of the most widely-read financial publications and has been a marquee speaker at financial seminars around the world.
© 2009 Copyright Guy Lerner - All Rights Reserved
Disclaimer: The above is a matter of opinion provided for general information purposes only and is not intended as investment advice. Information and analysis above are derived from sources and utilising methods believed to be reliable, but we cannot accept responsibility for any losses you may incur as a result of this analysis. Individuals should consult with their personal financial advisors.
Guy Lerner Archive |
© 2005-2022 http://www.MarketOracle.co.uk - The Market Oracle is a FREE Daily Financial Markets Analysis & Forecasting online publication.