Stock Market Symmetry Scenario Gives S&P 500 Decline More Room to Run
Stock-Markets / Stock Index Trading May 17, 2009 - 01:29 PM GMTBy: Mike_Paulenoff

 Let¹s say that the symmetry exhibited by the March-May rally with the
January-March decline continues into the future. What would the next leg of
the S&P 500 look like?
Looking at the e-mini futures chart (which gives us a view ahead of Monday¹s open on the cash markets), if we decide to take the May high at 929.50 as the end of the upleg from the March low at 662.50 -- which is symmetrical with the January-March decline -- then the current weakness into the 880-878 area represents THE START of a much larger downleg that will mimic the inverse of the November-January price move from 735.25 to 939.50.
That would mean that the e-mini S&P 500 has embarked on a decline into the vicinity of 735 to achieve symmetry within a much larger developing pattern -- after which another massively powerful bull leg will emerge that will leave behind a much larger base pattern from where an extended period of very positive price action could (will) emerge.
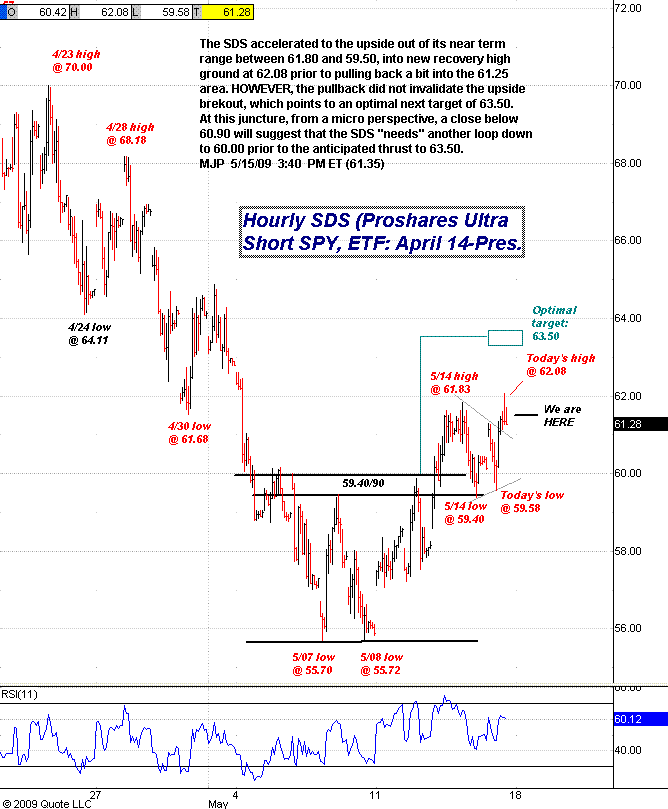
If the e-mini S&P opens weaker on Sunday-Monday and sustains beneath the 20 DMA (now at 879.20), then the ³symmetry scenario² will begin to gain added significance in my work. ETF traders might want to keep an eye on the ProShares Ultrashort SPY (NYSE: SDS), who chart is also included below the e-mini S&P chart.


Sign up for a free 15-day trial to Mike's ETF Trading Diary today.
By Mike Paulenoff
Mike Paulenoff is author of the MPTrader.com (www.mptrader.com) , a real-time diary of Mike Paulenoff's trading ideas and technical chart analysis of
Exchange Traded Funds (ETFs) that track equity indices, metals, energy commodities, currencies, Treasuries, and other markets. It is for traders with a 3-30 day time horizon, who use the service for guidance on both specific trades as well as general market direction
© 2002-2009 MPTrader.com, an AdviceTrade publication. All rights reserved. Any publication, distribution, retransmission or reproduction of information or data contained on this Web site without written consent from MPTrader is prohibited. See our disclaimer.
Mike Paulenoff Archive |
© 2005-2022 http://www.MarketOracle.co.uk - The Market Oracle is a FREE Daily Financial Markets Analysis & Forecasting online publication.


