


The Silent "Stealth" Rally in Gold
Commodities / Gold & Silver 2009 May 17, 2009 - 12:04 PM GMTBy: Clif_Droke

 It was a typical options expiration week with markets showing a lassitude that normally accompanies this event. Trading volume was relatively low and action was lacking for the most part across the board as traders seemed to be on a mental vacation this week.
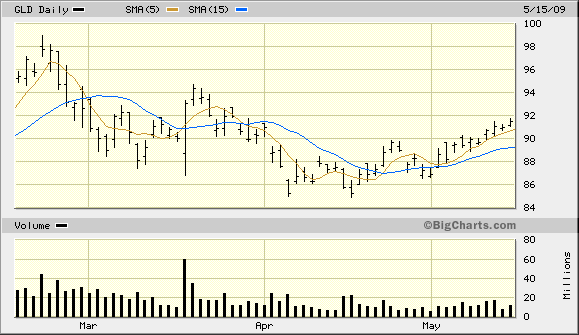
The SPDR Gold Trust ETF (GLD) was up for the week to finish at 91.55. This is our main proxy for the gold price and we have a trading position in GLD after we got a buy signal back in April when GLD broke out above the dominant immediate-term 15-day moving average.
As you can see here, GLD is still above the 5-day and 15-day MAs as of Friday’s close. The gain in GLD in recent days has been very gradual but steady and reflects the building of buying interest in gold as a “safe haven” as fears linger over the sustainability of the huge equity market gains since March. Institutional interest has seen gold and the gold ETFs turn into temporary vehicles to park gains from profitable equity trades during broad market corrections.
How much of gold’s rally is a function of future inflation expectations? That’s difficult to assess and we’re still too early in the financial recovery process to be able to answer this. The consensus among financial pundits is that gold is a “sure shot” to take off from here and eventually reach $1,000/oz. based on the multi-trillion dollar stimulus package. Some commentators are calling for even more liberal upside targets. It’s a common assumption that the stimulus will inflate commodities and spark another round of global inflation for hard assets. I would caution that this is far from a foregone conclusion, however.
The closest parallel, in purely financial terms, to what we’re seeing this year is the financial market recovery of 1975. That followed a severe pounding in equity prices that began in January 1973 and continued until the Kress 10-year and 40-year cycles bottomed in October 1974. Following this the Dow gained 100% off its’74 low and continued to rally into 1976. As we discussed in a recent report, the 10-year cycle low in 1974 coincided with the 6-year cycle peak in 1975 to form a bullish cyclical pattern that allowed share prices to rally vigorously for the single best percentage gain of our lifetime.
This year there is a somewhat similar cyclical pattern with the Kress 6-year cycle having bottomed last fall and is now ascending while the 10-year cycle is peaking. This is the reverse of what happened in 1975 but still the two key yearly cycles are in a bullish configuration, which partly explains the sizable gains that have already been made in equities this year.
So how did the gold price fare in 1975? After a parabolic type uptrend from 1971 through the early part of 1975, the yellow metal began a downtrend that lasted until the later part of 1976.
This is not to suggest that gold will necessarily repeat the 1975-76 bear market but it does show us that economic recovery (following the early ‘70s recession) and a financial market rebound (after the 40-year cycle bottom) don’t necessarily entail runaway commodity prices. If anything, historical analysis show us that commodity price rhythms typically alternate between periods of inflation and deflation in stock and commodity prices with stocks getting most of the benefit following severe bear markets. Once traders have capitalized on oversold and undervalued equity prices, the rally peaks out and money then shifts heavily into commodities, which is what occurred in the later part of the 1970s. Although I’m sure we’ll see some competition between stocks and commodities as this year progresses, much as we saw in the boom years between 2003-2007, the advantage currently resides with stocks and the odds favor equity price gains outdistancing commodity price gains this year.
Another reason for expecting the stock market rebound to exceed the commodity market rebound (including gold) is that before commodities can enjoy a full resurgence to pre-credit crisis levels of demand from industrial countries like China, corporate health must first show some stabilization and at least a baseline level of recovery. Balance sheets should improve before industrial capacity expands to a large extent. Some key industrial metals haven’t even shown noteworthy recovery as yet and we’ll need to see this before we can assert that commodities have started another boom phase. It is worth noticing, however, that a leading indicator for the general commodities market, CME Group (CME), is showing a strong foundation for a longer-term recovery. Take a look at the 1-year daily chart shown below for an example of this.
Gold’s latest rally is a microcosm of what I expect for 2009. The rally to date has been a “silent” one in that it hasn’t been overly exciting or suggestive of major inflation. Many traders have slept on this one despite being fairly profitable for us so far. But it does denote recovery and also perhaps reflects lingering concerns over the stability of the financial system, a carryover from last year’s severe bear market.
By Clif Droke
www.clifdroke.com
Clif Droke is the editor of the daily Gold & Silver Stock Report. Published daily since 2002, the report provides forecasts and analysis of the leading gold, silver, uranium and energy stocks from a short-term technical standpoint. He is also the author of numerous books, including 'How to Read Chart Patterns for Greater Profits.' For more information visit www.clifdroke.com
Clif Droke Archive |
© 2005-2022 http://www.MarketOracle.co.uk - The Market Oracle is a FREE Daily Financial Markets Analysis & Forecasting online publication.