Stock Market Counter Trend Rally on False Hopes of Green Shoots Recovery
Stock-Markets / Stocks Bear Market May 16, 2009 - 05:48 PM GMTBy: Tim_Wood
 A Brief History and Dow Theory Update - The method used and written about well over 100 years ago by Charles H. Dow were first termed “Dow’s Theory” after Dow’s death in 1902 by S.A. Nelson, who was a reporter for The Wall Street Journal under Dow’s stewardship. About a year following Dow’s death, William Peter Hamilton, who also served as a reporter under Dow began to write articles for The Wall Street Journal – mostly under the heading "The Price Movement." In these articles Hamilton analyzed and discussed, in terms of the investment or speculative outlook, the movements of the Dow-Jones Averages as related to business conditions in general.
Over a span of more than 25 years, as reporter and editor, Hamilton penned more then 250 editorials for The Wall Street Journal and Barron’s. It was then from the painstaking study of Hamilton’s articles, plus the material collected by Nelson, in conjunction with Hamilton’s book The Stock Market Barometer, that Robert Rhea was able to devise a series of useful and workable rules and definitions for the guidance of investors, speculators and businessmen generally, to aid them in determining the direction in which the broad tides of industry and stock prices were moving. These same methods are still valuable tools today and there are many who talk and write about Dow Theory. But, besides myself, I only know one other person who has read and studied the original writings on this subject and that is Richard Russell. It is my opinion that if one has not studies these original writings that it is impossible to understand orthodox Dow Theory and that is why so many misquotes occur.
Now, with this being said, a misconception in which I have recently received several e-mails on is that the Dow Jones Utility Average is part of Dow theory. This is NOT true. When reading these original writings the authors constantly referred to “both averages.” The two averages they were referring to were the Industrials and what was known as the “Rails” at that time and which later became known as the Transports. Also, the Dow Jones Utility Average did not even come to be until 1929, which was some 27 years after Dow’s death.
So, it is clear, based on these original writings, as well as the facts surrounding the origin of the Utilities that they without a doubt were not and are not a part of orthodox Dow theory. I want to also add that none of the technical indicators such as stochastic, RSI, the McClellan oscillator, etc. have anything to do with Dow theory either. I also must stress that cycles, Elliott Wave, point and figure charts, candle stick charts, gold, the dollar or anything else that you may think of have to do with Dow theory. At the core, the basis of Dow Theory has to do strictly with the price movement of the Industrials and the Transports above and below previous secondary high and low points. Yes, values, as Richard Russell often speaks of is a factor, but even then it all comes down to the price movement of both averages.
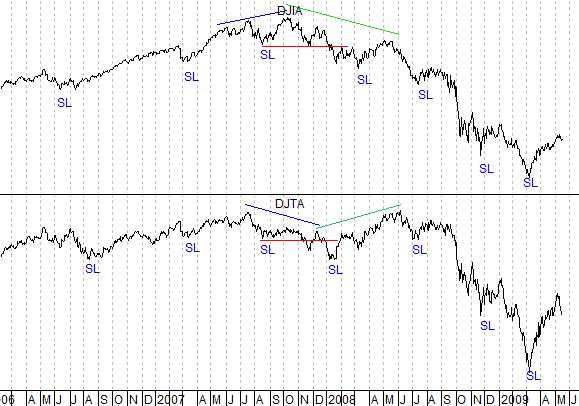
Robert Rhea wrote, “ Dow’s theory holds that the primary trend, once established, must always be considered to be in force until some indication in the averages nullify or reverses their earlier implication.” In light of this quote, the bearish primary trend that was established on November 21, 2007, when both averages closed below their previous secondary low points, still remains intact and to date, nothing has occurred to nullify or reverse that primary trend change. So, anyone suggesting that the Utilities or the S&P or anything else has recently triggered a “Dow Theory sell signal,” as I have recently been asked about, is incorrect. Fact is, the Bearish Primary Trend still remains intact in accordance with orthodox Dow Theory. A current chart of the Industrials and the Transports can be found below.

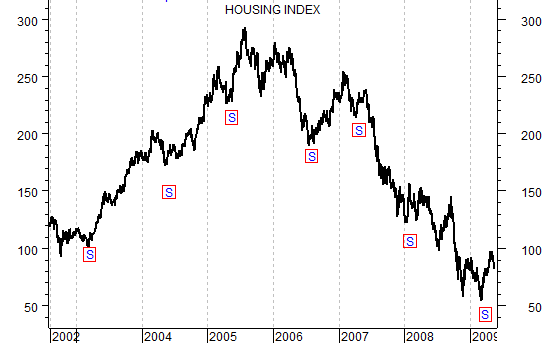
Next, I want to talk briefly about housing, which has absolutely nothing to do with Dow theory. I have included a chart of the Housing Index below. In most markets there is an annual cycle that averages some one year. I used this price behavior of this cycle along with my intermediate-term Cycle Turn Indicator to call the top of the housing market back in 2005 and this was first published here in October 2005 along with several follow ups as the top progressed. Of late I was asked, if the housing market was bottoming then would this not lead the stock market higher? With that in mind, I want to take a look at the Housing Index once again. Note that the last annual cycle, which I have marked with an “S” on the chart below last bottomed in March. From that low the Housing Index rallied with the overall market, but has more recently begun to decline with the overall market. The question now is, has the annual cycle advance run its course, or is this simply a correction that will be followed by higher prices?
At this point, the jury is still out on this because there is not enough technical/cyclical data for me to clearly pass this judgement. But, I can tell you this. Based on what I see at this point, the Housing Index is at an important juncture and is at great risk of the annual cycle having topped. If this decline isn’t soon halted, then the evidence will soon begin to suggest that the annual cycle has indeed peaked. If that proves to be the case, and I think there is a good chance that it has, then we will have a cyclically structured annual cycle that will set the stage for not only more weakness, but for more weakness for the remainder of this annual cycle. At this point, I simply must watch my intermediate-term Cycle Turn Indicator for guidance because this is the point where the rubber should met the road and we should get confirmation one way or the other real soon. Anyway, should this prove to be another top in the Housing Index, I do not see this weighing well for the economy. This would also be consistent with the fact that we still have a bearish primary trend in place in accordance with Dow theory, which is still suggestive of continued “stormy economic conditions.”

Based on the evidence at hand today, the bottom line is that the rally that began at the March low is a counter-trend affair. Nothing has occurred either cyclically or from a Dow theory perspective to change this opinion. The talk of “green spouts” is simply talk of false hopes for an early spring. The winter season in the market is not over and we all know what happens to “green spouts” when the reality of winter sets back in.
I have begun doing free Friday market commentary that is available at www.cyclesman.info/Articles.htm so please begin joining me there. The specifics on Dow theory, my statistics, model expectations, and timing are available through a subscription to Cycles News & Views and the short-term updates. In the May issue I cover the statistical implications for commodities, gold and the current cyclical and statistical implications for the current advance in the stock market. A subscription also includes very detailed slide show presentation on the big picture in equities, the 4-year cycle, commodities and what is expected to come. I also provide important turn point analysis using the unique Cycle Turn Indicator on stock market, the dollar, bonds, gold, silver, oil, gasoline, the XAU and more. A subscription includes access to the monthly issues of Cycles News & Views covering the Dow theory, and very detailed statistical based analysis plus updates 3 times a week.
By Tim Wood
Cyclesman.com
© 2009 Cycles News & Views; All Rights Reserved
Tim Wood specialises in Dow Theory and Cycles Analysis - Should you be interested in analysis that provides intermediate-term turn points utilizing the Cycle Turn Indicator as well as coverage on the Dow theory, other price quantification methods and all the statistical data surrounding the 4-year cycle, then please visit www.cyclesman.com for more details. A subscription includes access to the monthly issues of Cycles News & Views covering the stock market, the dollar, bonds and gold. I also cover other areas of interest at important turn points such as gasoline, oil, silver, the XAU and recently I have even covered corn. I also provide updates 3 times a week plus additional weekend updates on the Cycle Turn Indicator on most all areas of concern. I also give specific expectations for turn points of the short, intermediate and longer-term cycles based on historical quantification.
Tim Wood Archive |
© 2005-2022 http://www.MarketOracle.co.uk - The Market Oracle is a FREE Daily Financial Markets Analysis & Forecasting online publication.


