Reflections on the Price of Gold
Commodities / Gold & Silver 2009 May 15, 2009 - 10:24 AM GMTBy: Andrew_Butter
 I wrote an essay about gold a few weeks ago (Gold Price Forecast: Market-Long-Wave Analysis 2009-2012)
What was bothering me was along the lines of what Adam Smith once said, that "an owner-occupier house generates no income for its owner". That's of course until (perhaps) when he sells it; (equity withdrawals don't count- you are supposed to pay the money back so it's not income, and in those days they weren't blessed with the joys of credit default swaps). Gold is pretty similar.
What intrigued me was that there was such a good correlation between the gold price and miss pricing of housing in USA, particularly over the past ten years (two year lag). Anyway quite a few commentators said, "Well what's anyone going to do with that information?" Some gave me some quite helpful suggestions about where I might like to put that idea, (which I am considering very carefully).
The next "wild" thought I had was about the idea that apparently you could buy a great "new suit" in Roman times for one ounce of gold - and that's about the same today. But then I thought, OK so how many ounces of gold did you need in Ancient Rome to fill up your Ferrari? Spin it however you like, a Ferrari is not the same as a horse and cart (the latter is much more reliable).
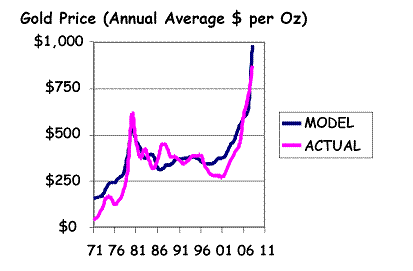
So off I went on another wild-goose-chase, perhaps the secret to gold lies in the price of oil? This is what turned up:
 That looks like a pretty reasonable rough and ready predictor model. OK there is a bit of a "wiggle in the middle", although it's possible those were market mis-pricing, evidence for that is perhaps that from the peak "mis-pricing" over the model in 1987 the price of gold then fell until it reached the model, and from the peak mis-pricing (according to this analysis) in 2001 it rose to meet the line of the model. That's consistent with the "General Theory of Market-Long-Waves" (Stock and Housing Market Long Waves and Stock Market "Sucker-Rally-Dead-Cat" Still Yowling! Market-Long-Waves Say's "Bull-Run Warning" ).
So presumably, if the past is any guide to the future, perhaps this model might do as a rough and ready crystal ball, although given the number of black swans there are hanging around these days; who-knows? (I keep telling everyone they are ducks, but no one believes me).
The inputs are:
(1) CPI in USA adjusted to take into account the widely held view that the US Government under-reports these numbers (Does Inflation Targeting Make Any Sense?) and (http://www.shadowstats.com/).
The way I calculate "real" CPI (which gives a slightly different result from the way Mike Shedlock does it, and a very different one from how Shadow Stats do it), is that I just assume that the main mistake is on the calculation of the "shelter" component (via rental equivalence), and I just add or subtract the change in house prices (using the S&P Case-Shiller Index) times 15% (on the assumption that they probably got it about half-right). I call that CPIX; OK that may sound a bit crude but that number seems to work quite well with other stuff and anyway, that's that the number I use.
(2) The oil price, there is nothing controversial about those numbers (these are annual figures so I use the annual average).
(3) Plus a bit-player that explains swings for in the model for low gold prices, the miss-pricing of the DJIA, how I work that out is explained in (Stock and Housing Market Long Waves).
This is the model plotted against actual for 1971 to 2008 (everything is annual averages):
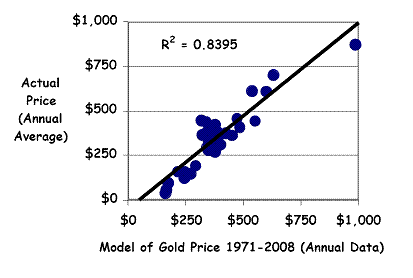
 OK, granted, 80% R-Squared is not exactly something to make you dance naked through the public baths shouting "Eureka", but at least (a) it seems to do a pretty good job around the peaks and more important, the inputs don't fly in the face of the weight of conventional opinion, which is a relief.
That's because the main driver of the model is CPI (which most people agree is a fundamental driver of gold since it is a "hedge against inflation"), but the model also accounts for the "new" gold, which is oil, that's an idea that was floated a month ago (The Impending Mother of all Oil Shocks ).
The relatively small role of stock-market miss pricing compared to gold reflects something else that is often thought to play a role, when the stock markets get seriously out of whack, people seem to go for gold.
Anyway, I ran the numbers for 2009 (full year) and 2010 for what I figured might be a base case (everything averages for the year): Of course for such a model to be useful you have to be able to come up with a reliable prediction of the price of other stuff, my current views on all of those are:
CPI: I think that the government is still talking of about 2% on 2009 (Q1 nominal GDP was minus 3.5% annualized and the "Real" number they reported was minus 6.1% so that implies an inflation rate of 2.6%). I actually find that hard to believe given that the price of everything I buy seems to have gone down; perhaps it's a mortal fear of even thinking the dreaded "D" word, and well if they keep that up they will probably say +2% in 2010 too. And who knows how much "real" inflation they will be able to create in 2011 when all those toxic assets become "liquid" again?
House Prices: (This affects what I call CPIX). The last time I looked at this was last January (Nouriel Roubini 2009 U.S. GDP Forecasting 40% Home Mortgage Failures? ) when I figured the total peak to trough would be 40%; if I remember correctly that gives about -15% in 2009 and say -2% in 2010. Those numbers depend on nominal GDP growth a little (I'm using nominal -2% for 2009 and +2% in 2010). OK opinions on that have changed a bit, and no one is quite clear about what is going to happen when all the Alt-A's reset (least of all me).
DJIA: I've been saying 40% mis-priced for 2009 and about 30% in 2010, I'm still sticking with those numbers (Stock Market-Long-Waves Say...Negligible Risk of Major Reversal Before Dow Crosses 10,000 ).
Oil : My view (http://www.marketoracle.co.uk/Article10260.html) is it's going up. Eyeballing I'd say $65 average for 2009 and $85 average for 2010. Oil is very hard to predict because there are politics involved and also speculators.
Put all those rough numbers in the pot and give it a stir and that gives gold averaging $761 in 2009 (which suggests a bit of a droop could be on the cards since it’s been flirting with $900 for most of the year), and about $862 in 2010 (full year averages).
So what if for example the US Government manages to achieve its objective of creating an approximation of hyperinflation so that all those bad debts can be magically forgiven? Say there is 4% CPI in 2009 (they say they managed to "achieve" 2.6% annualized already), and how about if "best-case" if they can ramp it up to 8% in 2010?
Well according to the model (keeping oil the same), that won't keep gold up much ($765 in 2009 average and $866 in 2010 average). What that says is that if this model is correct (and it could be wrong), the number to look at is not inflation at least until it starts going "hyper", it's oil prices.
So if the oil consumers manage to persuade their "old friends" to open up the taps and keep oil down below $60, (i.e. for the sake of "saving the world from a great depression" (if not from global warming)), for the base case ("official" CPI 2%), then the model says that gold will average $735 in 2009 and $705 in 2010.
Here is a nasty thought, by the same token if the oil producers were smart they might buy a lot of shorts, then open up the taps, watch gold go down to a nice level, then buy a lot of longs, then close the taps and push oil up to $150 (according to this model that would push gold up to $1,600 in 2010 on the base case).
Now that sounds like a plan.
By Andrew Butter
Andrew Butter is managing partner of ABMC, an investment advisory firm, based in Dubai ( hbutter@eim.ae ), that he setup in 1999, and is has been involved advising on large scale real estate investments, mainly in Dubai.
© 2009 Copyright Andrew Butter- All Rights Reserved
Disclaimer: The above is a matter of opinion provided for general information purposes only and is not intended as investment advice. Information and analysis above are derived from sources and utilising methods believed to be reliable, but we cannot accept responsibility for any losses you may incur as a result of this analysis. Individuals should consult with their personal financial advisors.
Andrew Butter Archive |
© 2005-2022 http://www.MarketOracle.co.uk - The Market Oracle is a FREE Daily Financial Markets Analysis & Forecasting online publication.


