Wholesale Prices Deflation, Largest 12-Month Decline Since 1950
Economics / Deflation May 15, 2009 - 03:31 AM GMTBy: Mike_Shedlock
 Inquiring minds are investigating the Producer Price Indexes For April 2009.
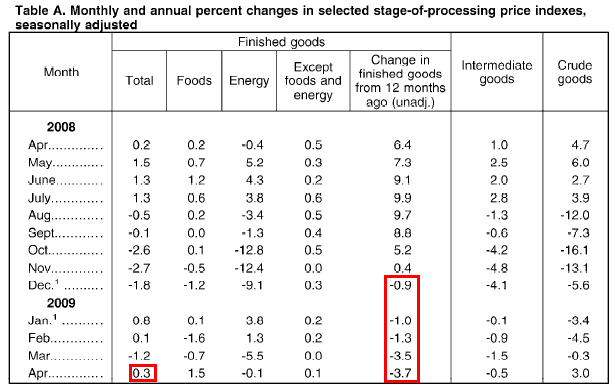
The Producer Price Index for Finished Goods increased 0.3 percent in April, seasonally adjusted, the Bureau of Labor Statistics of the U.S. Department of Labor reported today. This rise followed a 1.2-percent decline in March and a 0.1-percent increase in February. At the earlier stages of processing, prices received by producers of intermediate goods moved down 0.5 percent following a 1.5-percent decrease a month earlier, and the crude goods index advanced 3.0 percent after declining 0.3 percent in March.
The index for finished goods less foods and energy edged up 0.1 percent in April following no change in the previous month. In April, higher prices for light motor trucks, pharmaceutical preparations, and consumer plastic products slightly outweighed lower prices for civilian aircraft, tobacco products, electronic computers, primary batteries, and non-wood commercial furniture.
Finished Goods PPI

Although the above table shows an increase of .3% compared with last month, year over year comparisons have been negative for 5 consecutive months. Moreover, prices of light duty trucks were up in April. That will not last long because dealers must cut prices to liquidate inventory. In turn, 2009 inventory liquidation will negatively impact demand for cars and truck in 2010.
Intermediate and Crude Goods PPI

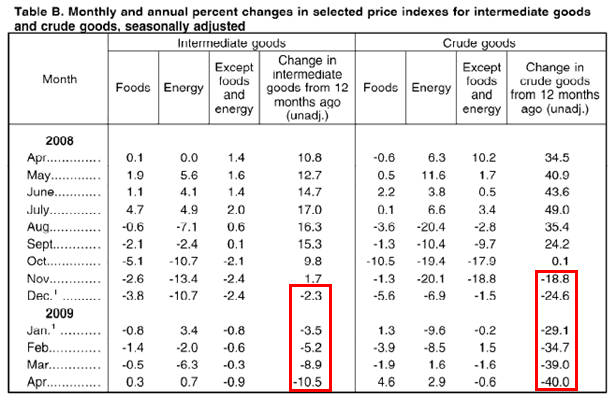
The table shows that in spite of crude prices rising from $35 in December to over $60 in May, that year over year comparisons are very favorable. Those comparisons will remain favorable for many months to come judging from energy prices.
$WTIC Light Crude Weekly Chart

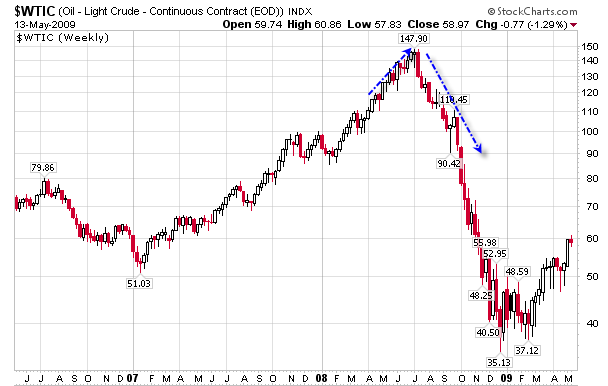
The above chart shows that year over year energy prices are going to be increasingly favorable at an accelerating rate for 3 months, then favorable at a decreasing rate for another 4-5 months. Thus I expect to see finished goods, intermediate goods, and crude goods prices to drop every month (year over year) for a full year.
Gasoline Prices - Where To From Here?
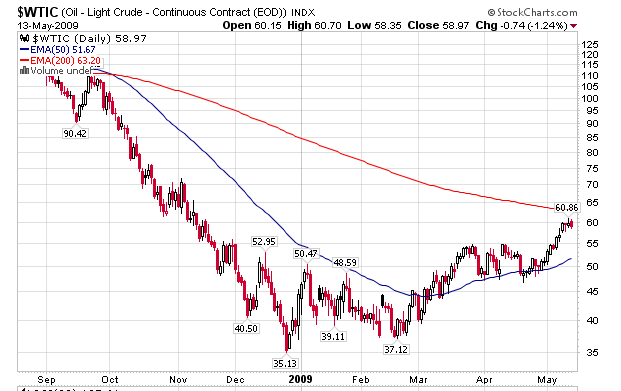
Inquiring might be asking about gasoline prices in the short term. Let's consider some technical and fundamental factors starting with the following daily chart of crude prices.
$WTIC Light Crude Daily Chart

Tight Storage May Lead To Huge Oil Price Drop
Technically, crude prices are a bit extended, no doubt in conjunction with the belief the economy is recovery. A likely place for the rally to fail would be near the 200 Exponential Moving Average (EMA) in red. Moreover, there are a number of fundamental reasons for the rally in crude oil prices to falter soon.
Please consider Tight storage may lead to huge oil price drop.
The present contango in oil prices bears all the hallmarks of an oil market where supplies are well above present fundamental physical consumption.
The recent large inventory build of petroleum, under a steep contango which now is flattening, within the big oil consumers (like the OECD countries and China) have left some with the expectation that major economies soon will begin to grow again, and that the contango now signals increased oil demand and higher oil prices in the future.
My analysis indicates that in recent months, as much as 2 -3 Mb/d of global petroleum supply has been used to build inventories. This is about to come to an end, because available storage is getting closer and closer to full and contango has begun to flatten. When additions to storage cease, the resulting drop in demand can be expected to lead to substantial downward pressure on oil prices.For further discussion of contango (cheaper front month prices) and some interesting charts on oil inventories, please click on the above link.
Crude Oil Daily Futures
Floating Storage
Because of the contango shown on the left, it may be cheaper to buy crude now, assuming one has storage, and storage costs are low enough.
Of course, whether it is wise to stock up now depends entirely on where prices head from here.
Regarding contango, a friend just pinged me with this comment:
"Nordic American estimates that up to 80 VLCC's (Very Large Crude Carrier) are currently used as 'floating storage'. I have heard from a shipping company in Hong Kong that they think it is even more, as China has apparently hired many of the old single hull ships to use as floating storage until it can build enough storage facilities on land. There's a lot of oil 'floating about', literally."All things considered, oil prices are due for a pullback and gasoline prices at the pump are likely to follow. Moreover, with the possible exception of food, consumer prices in general will remain under pressure, if not indeed negative on a year over year comparison basis for quite some time as well as falling producer prices pass up the chain
By Mike "Mish" Shedlock
http://globaleconomicanalysis.blogspot.com
Click Here To Scroll Thru My Recent Post List
Mike Shedlock / Mish is a registered investment advisor representative for SitkaPacific Capital Management . Sitka Pacific is an asset management firm whose goal is strong performance and low volatility, regardless of market direction.
Visit Sitka Pacific's Account Management Page to learn more about wealth management and capital preservation strategies of Sitka Pacific.
I do weekly podcasts every Thursday on HoweStreet and a brief 7 minute segment on Saturday on CKNW AM 980 in Vancouver.
When not writing about stocks or the economy I spends a great deal of time on photography and in the garden. I have over 80 magazine and book cover credits. Some of my Wisconsin and gardening images can be seen at MichaelShedlock.com .
© 2009 Mike Shedlock, All Rights Reserved
Mike Shedlock Archive |
© 2005-2022 http://www.MarketOracle.co.uk - The Market Oracle is a FREE Daily Financial Markets Analysis & Forecasting online publication.


