Technical Leading Stock Market Indicators That Professional Investors Look At
Stock-Markets / Stock Index Trading May 13, 2009 - 04:32 PM GMTBy: Marty_Chenard
 Professional investors have an advantage for a lot of reasons. One reason is because of the amounts and types of data they look at.
One thing that professional investors keep an eye on is the volume of Advancing and/or Declining shares every day.
This first matrix shows that data for the New York Stock Exchange, the NASDAQ, the American Stock Exchange, and the Over The Counter Bulleting Board. (OTC stocks are generally unlisted stocks which trade on the Over the Counter Bulletin Board (OTCBB) or on the pink sheets.)

To get a better feel for what went on yesterday, we added the Advancing Share volume to the Declining Shares for a total. Then, we calculated the percent declining or advancing as seen below.

A picture is worth a thousand words ...
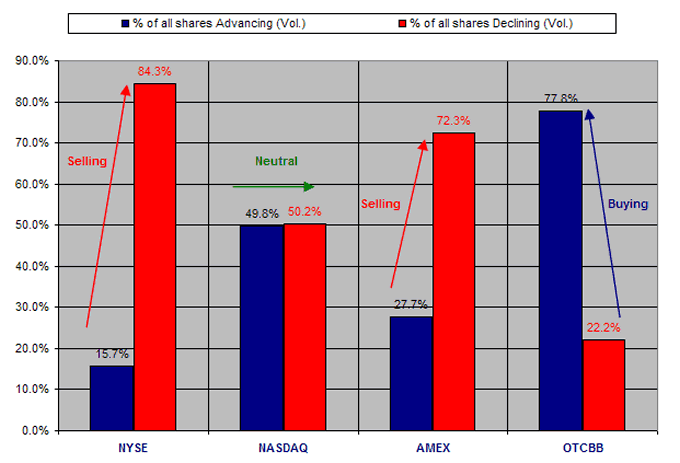
Sometimes, putting data in a chart form is much easier and quicker to read and understand. The chart below shows the action for the above data.
What do you notice that was significant about yesterday?
First look at the NYSE (NYA) exchange where most of the Institutional trading volume occurs. Note that most of the share volume was declining, indicating that the large investors were selling.
Next look at the NASDAQ ... the buying and selling volume was nearly EQUAL. A pretty balanced day with little bias to either side.
The American Stock Exchange (AMEX) showed the same profile as the NYSE, except that there was less selling.
Now, look at the "small investor's exchange" ... the Over the Counter exchange. Here we see just the opposite. Instead of selling, they were unaware of what was going with the larger investors and they were buying.
Conclusion: Larger investors were taking profits, while smaller investors were still buying.

*** Feel free to share this page with others by using the "Send this Page to a Friend" link below.
By Marty Chenard
http://www.stocktiming.com/
Please Note: We do not issue Buy or Sell timing recommendations on these Free daily update pages . I hope you understand, that in fairness, our Buy/Sell recommendations and advanced market Models are only available to our paid subscribers on a password required basis. Membership information
Marty Chenard is the Author and Teacher of two Seminar Courses on "Advanced Technical Analysis Investing", Mr. Chenard has been investing for over 30 years. In 2001 when the NASDAQ dropped 24.5%, his personal investment performance for the year was a gain of 57.428%. He is an Advanced Stock Market Technical Analyst that has developed his own proprietary analytical tools. As a result, he was out of the market two weeks before the 1987 Crash in the most recent Bear Market he faxed his Members in March 2000 telling them all to SELL. He is an advanced technical analyst and not an investment advisor, nor a securities broker.
Marty Chenard Archive |
© 2005-2022 http://www.MarketOracle.co.uk - The Market Oracle is a FREE Daily Financial Markets Analysis & Forecasting online publication.


