Gold's Weak Rally Lags Silver Real Strength
Commodities / Gold & Silver 2009 May 09, 2009 - 02:45 PM GMTBy: Merv_Burak
 Gold seems to want to move but is having a rough time of it. The strength behind the recent advance seems to be somewhat pathetic. Let’s go to the charts and indicators.
GOLD : LONG TERM
Despite the slightly higher weekly close the long term P&F chart of gold has not changed. We are still under the last signal, which was a bear signal, with a $705 projection. To reverse back to a bull market we need gold to hit $930 for an initial projection to $1050.
As for the normal indicators, they are all unchanged from last week. After bouncing off its long term moving average line gold remains above the line and the line continues to point higher. The long term momentum indicator remains in its positive zone and above a positive trigger line. The indicator seems to be in no mood to go anyplace and is tracking more of a lateral path than a positive one. The volume indicator is also not all that great and tracking a lateral path. It remains below its negative sloping trigger line for a negative reading. However, putting it all together I still get a BULLISH rating for the long term.
INTERMEDIATE TERM
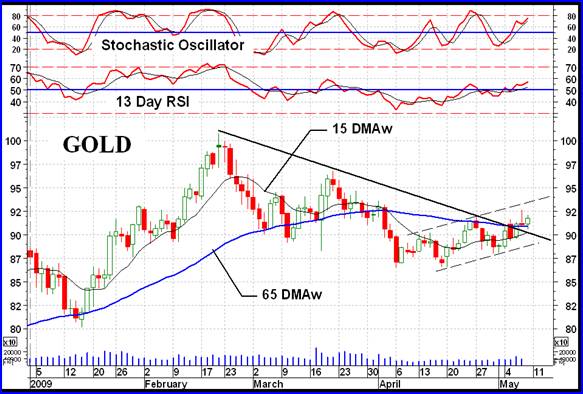
On the intermediate term things seem to be looking up but not in a strong manner. Gold has now closed above its intermediate term moving average line but the line slope remains in a downward direction, not yet confirming the break. As the short term chart shows, the down trend line (an intermediate term one) has been broken on the up side this past week. The momentum indicator is in its positive zone but only slightly. It is also above its positive trigger line. A positive sign but with not much strength behind it. The volume indicator, although in a lateral drift, is above its positive trigger line. Lastly, I have been mentioning to my subscribers the interesting trading technique for gauging when a move goes positive on an intermediate term basis. This involves the short term moving average line crossing above the intermediate term moving average line and has worked very well with many gold and silver stock picks. Although here the short term line is moving higher it has not yet crossed above the intermediate term line and therefore has not confirmed (by this technique) an intermediate term bull move. However, putting my normal indicators together I get a BULLISH intermediate term rating although as mentioned, not all that strong yet.
SHORT TERM
On the short term everything seems to be just rosy. Gold broke back above its short term moving average line during the week and the line has once more turned upward. The momentum indicator is once more back in its positive zone and above a positive trigger line. Only the daily volume action seems to be holding back. It could be a lot better although during this time of year it seems to always be lower than at other periods. The recent action has been trapped within an upward tracking channel and I expect that the action will remain within this channel for a while. The short term rating can only be BULLISH.

As for the immediate direction of least resistance, well I think I’ll go with the up side although the aggressive Stochastic Oscillator is very close to entering its overbought zone which could put a damper on much more upside moves.
SILVER

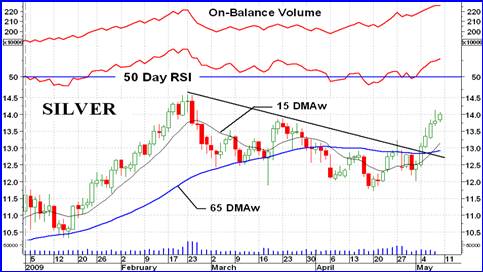
As mentioned last week, unlike gold, silver has not given us a P&F bear market signal. It has been acting stronger than gold recently and this past week gained 12.0% versus gold’s gain of only 3.3%. Just a quick look at the difference in the two price actions highlights the difference in recent performance of the two metals. Silver is now above its mid-March highs while gold is still some distance below its mid-March highs. Although I had not shown gold’s volume indicator it is tracking a lateral path at its recent lows. Silver’s volume indicator has been on a tear and is now at new high levels. I’m sure there must be some fundamentals that provide the reason for this difference but is it really necessary, when the charts tell the story.
With the action in silver this past week all of the indicators have turned positive. On the long term silver is above its positive moving average line and the momentum indicator is in its positive zone above a positive trigger line. The same for the intermediate and short term indicator. Therefore the ratings for all three of the time periods is BULLISH.
On an immediate term basis, the Stochastic Oscillator is already in its overbought zone and has flattened out possibly ready to move lower and back below the overbought line. If it did that it would signal a possible halt to the recent upside price moves, at least for a short period. In the mean time once the Stochastic Oscillator goes into its overbought zone one must expect that the potential of further upside moves has greatly been diminished.
PRECIOUS METAL STOCKS
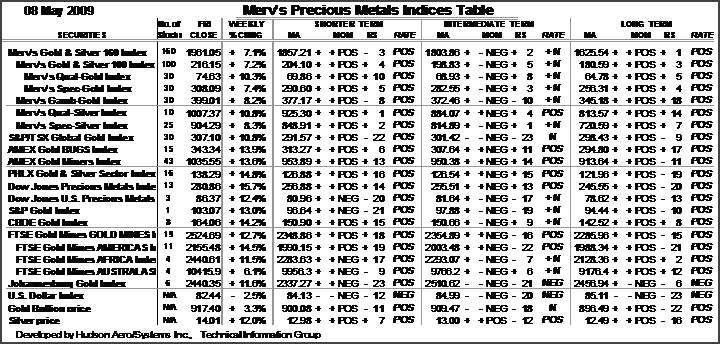
As you can see from the Precious Metals Indices Table, it has been a pretty good week for the precious metal (Gold & Silver) stocks. One can easily see from the various Merv’s Indices that this week the “quality” stocks were the winners while the speculative or gambling variety stocks had a lower overall performance. This seems to go in undetermined cycles. All of the Merv’s Indices are back at new recovery highs.
For those of you who are not long time readers of my commentaries and wish to better understand what the Merv’s Indices are, that are listed in the Table, a brief description follows.
My “universe” is my Gold & Silver 160 Index. All of the stocks included in the various other Indices are included in this Index. As the title implies, this Index includes 160 gold and silver stocks traded in the North American markets.
My Gold & Silver 100 Index includes the top 100 gold and silver stocks traded on the North American market, based upon market value.
My Qual-Gold Index includes the top 30 stocks traded on the North American markets, again based upon market value. This is the “quality” index.
My Spec-Gold Index includes the next top 30 stocks traded on the North American markets, after the Qual-Gold stocks, again based upon market value. This may be seen as the Index of the “second tier” stocks.
My Qual-Silver Index includes the top 10 stocks by market value, with significant silver involvement.
Those Indices listed above have firm criteria for the component stock listing. The remaining two Indices are a catch all. They include stocks that are far more speculative than the previous Indices. In fact many, if not most, of these stocks could be categorized by some as outright gambles. They include many real “penny” stocks and some that are in the dollar range.
My Gamb-Gold Index includes 30 stocks of the very speculative or gambling variety. They are primarily gold stocks although some may have silver interests in addition to gold.
My Spec-Silver Index includes 25 stocks of the very speculative or gambling variety. They are all silver stocks although some may have gold interests in addition to silver.
So, why a variety of Indices? Well, not all category of stocks are moving at the same time. It is known that at the start of a new bull market in precious metal stocks (or any stocks) it is the “quality” sector that is moving initially. After some time, once the investing and speculative public becomes more comfortable with the bull market their trading then turns to the more speculative variety of stocks. It’s good to know when a category starts to move or is moving so as to reduce risk in speculating in stocks of that category. The more speculative stocks are often the first to top out at the end of a bull. One would want to know when this is happening as a possible advance warning when one might be holding the more quality stocks.
The Table of Indices posted with this commentary provides you with the information you might need to reduce risk in your investment or speculative activities.
Merv’s Precious Metals Indices Table

Well, I’ll call it another week.
By Merv Burak, CMT
Hudson Aero/Systems Inc.
Technical Information Group
for Merv's Precious Metals Central
For DAILY Uranium stock commentary and WEEKLY Uranium market update check out my new Technically Uranium with Merv blog at http://techuranium.blogspot.com .
During the day Merv practices his engineering profession as a Consulting Aerospace Engineer. Once the sun goes down and night descends upon the earth Merv dons his other hat as a Chartered Market Technician ( CMT ) and tries to decipher what's going on in the securities markets. As an underground surveyor in the gold mines of Canada 's Northwest Territories in his youth, Merv has a soft spot for the gold industry and has developed several Gold Indices reflecting different aspects of the industry. As a basically lazy individual Merv's driving focus is to KEEP IT SIMPLE .
To find out more about Merv's various Gold Indices and component stocks, please visit http://preciousmetalscentral.com . There you will find samples of the Indices and their component stocks plus other publications of interest to gold investors.
Before you invest, Always check your market timing with a Qualified Professional Market Technician
Merv Burak Archive |
© 2005-2022 http://www.MarketOracle.co.uk - The Market Oracle is a FREE Daily Financial Markets Analysis & Forecasting online publication.


