


Gold Today and Nasdaq 1995, Secular Bull Market Fundementals
Commodities / Gold & Silver 2009 May 07, 2009 - 11:22 AM GMTBy: Jordan_Roy_Byrne

 There are technical and fundamental similarities in all bull markets. In the case of Gold today and the Nasdaq in the mid 1990s, there are several key technical similarities. I will show these in two charts.
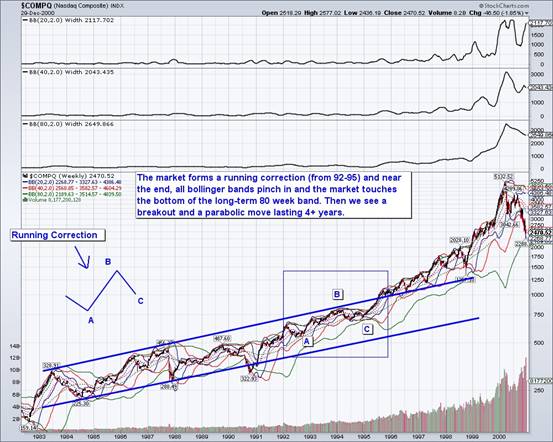
In this case there are three important similarities. There is a running correction for a few years, the squeezing in of several bollinger bands and finally, a breakout from the price channel. Below is a chart of the Nasdaq. The running correction occurred from 1992 to 1995. As the market began its parabolic ascent (in 1995), all the bollinger bands (20, 40 and 80 week) were squeezed in which suggests a strong move in all time frames. Each time the market touched the lower 80-week band (1984, 1987, 1990, 1994, 1998) proved to be a very important low.
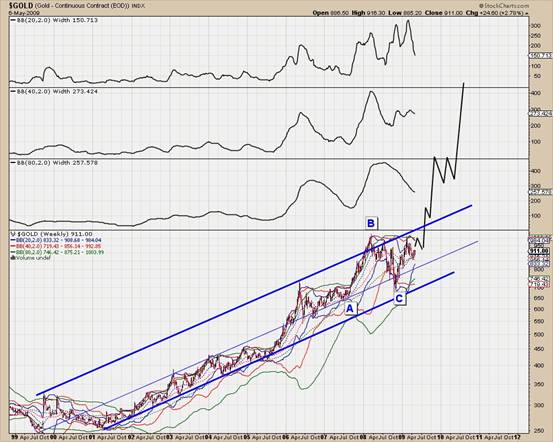
The same things are evident in Gold’s chart below. The action since May of 2006 has been a running correction. We showed the form in the last chart. (Essentially, the counter-trend “B” move advances to a new high followed by a “C” decline that bottoms right at or near the previous impulsive top, which in this case is May 2006). Secondly, all of the bollinger bands are squeezing in. The market already touched the lower 40-week band, which hadn’t happened since 2005. The market came very close to touching the lower 80-week band. That hasn’t happened since 2001. A correction of primary degree is in the later stages.
Conclusion
These charts show how secular bull markets move from steady and gradual to parabolic. The transition involves a long corrective period that is difficult to correctly diagnose until its later stages. The bollinger bands are extremely helpful as they allow us to measure volatility across all time frames. For Gold, its primary correction is near its end while the short and medium term corrections may have a bit more time to go. We’d like to see volatility in those time frames compress a bit more. Stay tuned for our next update, as we’ll have more insightful charts.
By Jordan Roy-Byrne
trendsman@trendsman.com
Editor of Trendsman Newsletter
http://trendsman.com
Trendsman” is an affiliate member of the Market Technicians Association (MTA) and is enrolled in their CMT Program, which certifies professionals in the field of technical analysis. He will be taking the final exam in Spring 07. Trendsman focuses on technical analysis but analyzes fundamentals and investor psychology in tandem with the charts. He credits his success to an immense love of the markets and an insatiable thirst for knowledge and profits.
Jordan Roy-Byrne Archive |
© 2005-2022 http://www.MarketOracle.co.uk - The Market Oracle is a FREE Daily Financial Markets Analysis & Forecasting online publication.