Wall Street Oligarchs Engineer Stock Market Recovery
Stock-Markets / Stocks Bear Market May 05, 2009 - 08:14 PM GMTBy: Gary_Dorsch
 An eight-week-long upturn in European, Japanese, US and emerging stock markets since March 10th has sparked a wave of optimistic commentaries in the financial media, that the worst bear-market since the 1930’s has finally come to a merciful end, and the rocky road to recovery lies ahead. Since hitting a 12-year low on March 6th, the key global benchmark – the S&P-500 Index has rebounded by +34%%, while the KBW Index measuring 24-US-banks doubled off its lows.
The stunning rebound from March 6-20th was only the fifth-time since 1929 that the S&P-500 Index has run-up by more than +20% in 14-days or less. The rebound has been dubbed the “Green Shoots” Rally, - signaling the initial stages of a recovery in the battered global economy. Most importantly, under heavy political pressure from the Fed and Congress, FASB altered rule #157, to allow American bankers to value toxic assets, at their own discretionary judgment.
 The switch-back to “mark-to-make-believe” accounting is an expedient scheme that allows the banking elite to conceal their losses, and use the same obscure and discredited models to inflate their balance sheets. The recent spate of better-than-expected earnings reports by US-banking giants, Goldman Sachs, JP-Morgan, Citigroup, Bank of America, and Wells Fargo is a testament, not to the strengthening of the real economy, but rather due to accounting gimmickry.
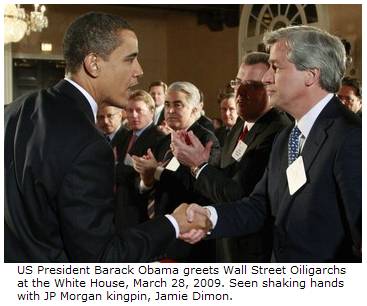
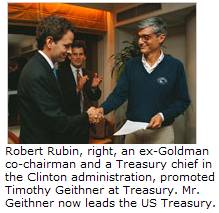
Barack Obama, elected by appealing to a popular rejection of the Bush administration’s economic policies, has become the new political lackey for the financial aristocracy. His pick for US Treasury chief, Timothy Geithner, is continuing the same policies as his mentors, former Goldman Sachs CEO’s Henry Paulson and Robert Rubin. Step by step, the Fed, the Treasury, Congress, and the White House have allocated an unprecedented $12.9-trillion of taxpayer money and guarantees, to rescue the nation’s top financiers from their own greedy mistakes.
US Treasury chief Geithner was a leading architect of the bank bailouts during the financial crisis, while forging close relationships with executives of Wall Street’s giant financial institutions. His actions, as a regulator and bailout king often aligned with the industry’s interests and desires. Wall Street’s share of all company profits in the S&P 500 reached a record 42% in 2006, and with it, greater influence over corrupt politicians in Washington from both political parties.
The Wall Street oligarchs are now utilizing trillions in US-taxpayer bailout money and government guarantees, to bolster their balance sheets and generate profits, and speculating in turbulent financial markets. Since March 6th, what’s evolved is a rising US-stock market and inflated bank profits, which in turn, conjures-up hopes that banks will start lending again, to free-up capital for new investment and spending.
Many investors are skeptical of the “Green-Shoots” rally, and prefer to call it a “bear-market” suckers’ rally, - one that is destined to fizzle-out and unravel. Yet today’s bargain hunters see a “once-in-a-lifetime” buying opportunity, and are guided by the sagely advice of Sir John Templeton, “Bull-markets are born in pessimism, grow on skepticism, mature on optimism, and die of euphoria.”
Referring to the 1930’s Great Depression, Warren Buffett pointed out that the Dow Industrials hit bottom in July-1932. “Economic conditions continued to deteriorate until Franklin Roosevelt became president in March-1933, but by that time, the market had already climbed 30%. “While short-term stock-market movements can’t be foretold, the likelihood is the market will recover before the economy, or general investor sentiment does, and if you wait for the robins, spring will be over,” he said.
IMF Issues Grim Forecast for 2009,
On April 23rd, IMF chief Dominique Strauss-Kahn sounded some strong words of caution, which were ignored in the marketplace. “Despite some red lights and green lights, our belief is the financial crisis is far from over. There are still long months of economic distress in front of us,” Kahn warned. The IMF predicted on April 21st, that worldwide financial institutions could suffer $4-trillion in losses from the global credit crisis. “Historically, wherever recessions are preceded by financial crises they are more severe and longer lasting,” warned IMF Chief Economist Olivier Blanchard, “there would be no rapid recovery from the current economic crisis.”
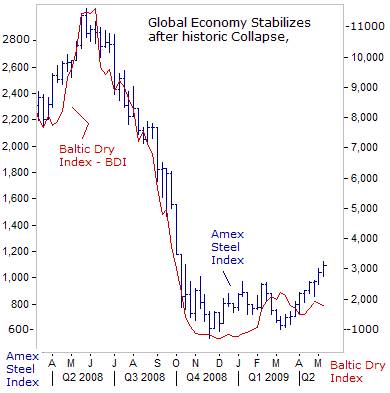 The Group-of-Seven economies, which account for two-thirds of the world’s output, experienced an “unprecedented” -7.5% contraction in real GDP, on an annualized basis, during the fourth quarter. The world’s steel industry, a key lynchpin in the auto and construction industries, is bracing for a sharp -15% drop in demand, the biggest annual decline since World War II, as the global economic downturn rips through the sector, lowering output to an estimated 1-billion tons. Demand for the steel is seen falling 36% in the United States and 28% in Europe.
The IMF’s “World Economic Outlook,” released on April 21st, predicted negative 1.3% growth for the global economy this year, “Not since the 1930’s has the global economy undergone a collective contraction,” the IMF said. The Euro-Zone’s economy is projected to contract -4.2%, Japan -6.2%, Russia -6%, and the Asian tiger economies, Singapore -10%, and Taiwan -7.5%, the worst affected. China and India are forecast to grow +6.5% and +4.5% respectively, but nevertheless, a major slowdown in both countries, and likely to increase their jobless rates.
Wall Street’s best month in nine-years,
Yet despite these ominous warnings, all three major US-exchange indexes closed sharply higher in April, with the Dow Jones Industrials surging towards the 8,500-level, led by the financial sector. April was Wall Street’s best month in nine-years -- offering a glimmer of hope that just maybe, the US-economy is finally about to stabilize. Bolstering this view, pending sales of existing US-homes rose +3.2% in March, and +2% in February, and starting to work-off excess inventories, - a key to stabilization in the financial system and broader economy.
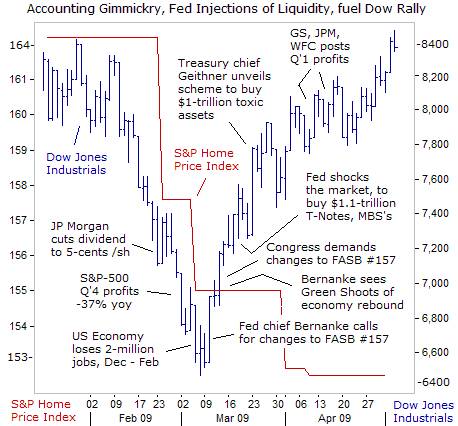
On paper, US-stocks recouped $2.3-trillion in value since March 6th. The S&P-500’s gain of +18.7% in March-April was its best two-month rally since 1975. The junk bond market gained a record +11% last month. In previous bear-markets over the past 60-years, the S&P-500 Index has hit bottom an average of four-months before the recession ended, and nine-months before unemployment hit its peak.
The Dow Industrials’ biggest one-day surge this year, occurred on March 23rd, when US Treasury chief Geithner, unveiled a clever scheme to enable Wall Street’s elite banks to offload up to $1-trillion of their bad mortgage loans and other “toxic” assets at inflated prices. The scheme involves the use of taxpayer funds to guarantee large profits for hedge-funds, private-equity firms, and big insurance companies, utilizing low-interest, non-recourse, government loans to purchase toxic securities that are weighing down the balance sheets of the banks.
Geithner’s scheme is designed to provide a windfall for the very same bankers and investment firms which precipitated the deepest economic crisis since the 1930’s, and the loss of 5-million US-jobs, by peddling high-risk, toxic investments that generated extraordinary returns, - until the housing and debt bubbles burst, - and sustained the multi-million-dollar bonuses of Wall Street CEO’s and traders.
Bernanke sees “Green-shoots” Sprouting in US-Economy,
On March 15th, in his first television interview, Fed chief Ben “Bubbles” Bernanke predicted that America’s worst recession since the 1930’s would likely end this year before a recovery gathers steam in 2010. “The green shoots of economic revival are already evident,” Bernanke told CBS’s program 60-Minutes. “Much depends on fixing the banking system. We’re working on it. I think we’ll get it stabilized, and see the recession coming to an end this year,” he said.
“We’ll see recovery beginning next year. And it will pick up steam over time.” Asked if the United States had escaped a repeat of the 1930’s Great Depression, Bernanke said: “I think we’ve averted that risk.” A few days later, the Bernanke Fed said it would buy $1.1-trillion of Treasury notes and MBS’s, with money rolling-off its electronic printing press. The massive cash infusion is channeled into the coffers of the Wall Street Oligarchs, and is starting to flow into the credit markets.
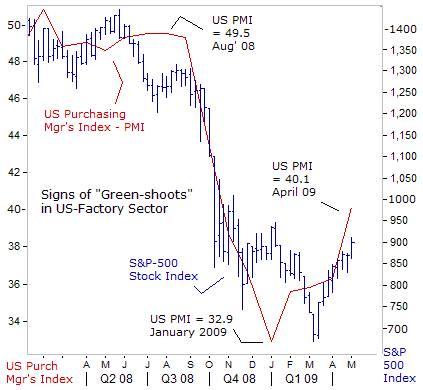
Six weeks later, the ISM’s index of national factory activity, - a leading indicator for the US-economy as a whole, jumped to 40.1 in April from 36.3 in March, a sign that “green shoots” are sprouting in the battered sector, - even before Obama’s $787-billion stimulus plan kicks-in. Most encouraging, the ISM’s index for New-Orders jumped 14% to 47.2 in April, the highest since August 2008, from 41.2 in March, and the employment index rose to 34.4 in April, from 28.1 in March.
In hindsight, the US-factory index began to stabilize two-months before the S&P-500 bear-market hit its bottom. In other words, the sharp slide in the global equity markets in January-Feb could have been the final-stage of selling capitulation at the tail-end of a 17-month bear market. The post March 6th recovery rally is catching-up to the green-shoots sprouting in the factory sector.
Nowadays, news that would have sent the stock market into a frenzied meltdown just a few-months ago is now taken calmly in stride. Instead, traders search for silver linings in reports with negative headlines. For example, US-gross domestic product (GDP) plunged -6.1% on an annualized basis in the first quarter of 2009, a far steeper decline than predicted. Following a -6.3% GDP-decline in the last three months of 2008, it was the biggest six-month contraction in 50-years.
But buried within the report, was information that US-business inventories were whittled down by a whopping $103.7-billion in the first-quarter, which is good news for the economy, because it suggests businesses have cut their stockpile of unsold merchandise to levels that will soon encourage them to start placing new orders, which in turn, would stimulate production and demand for raw materials
“Green Shoots” Sprouting in Indian Economy,
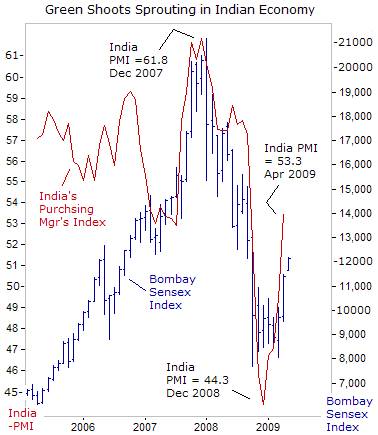 In the emerging world, India’s factories are humming again for the first time in five-months as new orders are building-up in the pipeline, pointing to a tentative “Green-Shoots” recovery. India’s purchasing managers’ index (PMI), based on a survey of 500-companies, rose to 53.3 in April from 49.5 in March, climbing above the key threshold of 50 that separates expansion from contraction. India’s PMI has jumped to its highest in seven months after hitting a trough of 44.3 in December. The new orders index rose to 54.9 from 49.5 in March.
Like other emerging markets, India was hurt by huge outflows of “hot money,” from last year, hammering its stock market into a rout and knocking the rupee 20% lower against the dollar .Foreign investors sold $13-billion worth of Indian shares in 2008, compared to a record influx of $17.4-billion in 2007. But since March 6th, the pendulum has swung again, back in India’s favor. Foreigners bought $1.8-billion of Indian stocks in April and the rupee gained 2.3% against the dollar.
The Bombay Sensex Index rebounded above the psychological 12,000-level for the first time since early October, with all its components advancing. Bombay has soared +51% since hitting a low of 8,047 on March 6th, and is up +26% this year after slumping -52% in 2008. The benchmark jumped +17.5% in April, its best monthly gain in 10-years, and the top performing Asian index last month.
India’s $1.2-trillion economy expanded at an average 9% for four straight-years, but it’s vulnerable to outside influences in the global economy. Over the past two-decades, successive governments have transformed the country into a cheap labor platform, particularly for hi-tech information technology and related business services. Major corporations from around the globe have exploited its large supply of highly-trained, English-speaking graduates to cut business 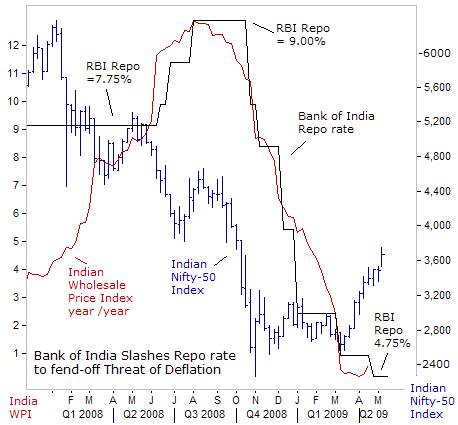 service costs. Yet fully 70% of India’s population of 1.1-billion survives on less than $2 per day.
While many Indian analysts have said the Sensex recovery since early March is a “bear-market” rally, some have switched their opinions, and now believe this could be the start of a new bull-run. Shares in Indian banks were hit by the global downturn, but are now attracting foreign investors on signs of an economic recovery, with bad debts not as large as their American or European peers.
India’s inflation slowed to an all-time low of 0.27% in April, giving the Bank of India room to cut interest rates further to support a faltering economy. The RBI’s key repo rate, at which it lends to commercial banks, is pegged at a record low of 4.75% from a peak of 9.0% last year. Accompanying the rate cuts, are three fiscal stimulus plans involving tax and duty cuts, infrastructure spending, and other steps, totaling $4-billion. Sectors such as steel, automobiles, and cement are already showing renewed strength in the domestic market. Still, India’s export-related industries must wait for genuine recovery in the G-7 nations and other developed markets.
Shanghai Red-chips are back in favor,
In Beijing, the ruling Politburo is ordering the People’s Bank of China (PBoC) to massively inflate the M2 money supply, and removing lending restrictions to revive the world’s third-biggest economy. State-owned Chinese banks extended 4.58-trillion yuan ($670-billion) of new loans in Q’1, including loans to speculators in Shanghai red-chips,andfueling the initial stages of a stock market recovery. Shanghai red-chips have climbed above 2,500, from a low of 1,700 in November, under a rising tide of liquidity injected by the PBoC.
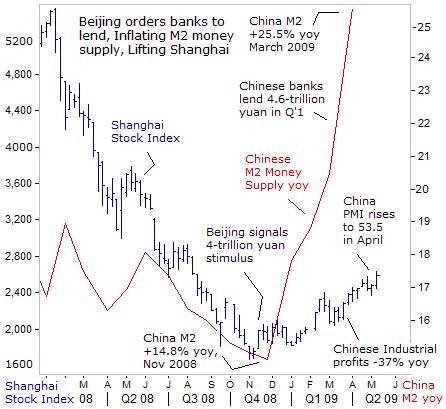
Coupled with Beijing’s 4-trillion yuan spending plan, the stimuli is the equivalent of 32% of China’s entire economic output per year. Most interesting, the Shanghai rally began to gain momentum in the first-quarter, when Chinese industrial firms earned a combined 219-billion yuan ($32-billion) in profits in the first two-months of 2009, down -37% from a year earlier. The figure marked a sharp slide from annual growth of +5% in the first 11-months of last year.
Thus, the Shanghai red-chip rally is inflating P/E ratio to risky levels, due to a rising tide of liquidity. China’s M2 money supply is exploding at an annualized 25.5% clip, distorting market values. Chinese banks are funneling yuan into the coffers of big trading firms, who in turn, are bidding-up red-chips. Beijing’s double-cylinder fiscal and monetary stimuli have been aggressive and are already starting to pay dividends in the real economy, and base metals markets.
Chinese factories gained further momentum April, adding to tentative evidence that “green-shoots,” are blossoming into a full fledged recovery. China’s factory PMI rose to 53.5 in April from 52.4 in March, reflecting strength in output and new orders. It was the fifth-month in a row that China’s PMI has improved and the second straight month it’s been above the 50-mark.
Brazil’s currency Tracking Green Shoots
After dumping $43.7-billion worth of Brazilian bonds and stocks in the second half of last year, “hot-money” is returning to Sao Paulo, home of Brazil’s Bovespa Index. Amid signs of sprouting “Green-Shoots” in the Chinese, Indian, and US-economies, the Brazilian stock market is up +26% so far this year, after tumbling a record 41% in 2008. Foreigners were net buyers of $1.5-billion of Brazilian stocks last month, and Brazil’s trade surplus doubled from a year ago to $3.7-billion.
China has become the biggest customer of Brazilian exports in recent months, surpassing the United States as the country’s main trading partner for the first time ever. Brazil is among the world’s top commodity exporters and sales abroad rose +4.3% in April to $12.3-billion. While exports were rising, Brazil’s imports fell 14% in April to $8.6-billion widening its overall trade surplus.
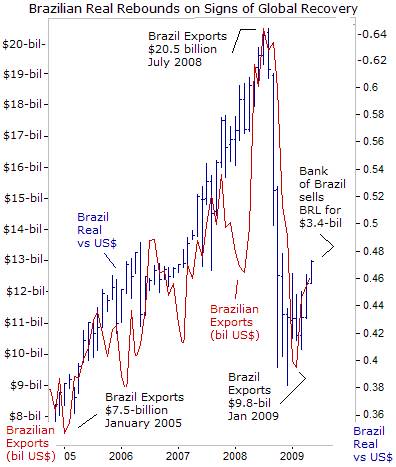 Asian steelmakers may lose their battle for a 40% cut in annual iron ore prices, as firm spot prices and rebounding steel output in China, the world’s top steelmaker, puts iron-ore miners in a better position for contract talks. The world’s top-three miners of iron-ore, BHP Billiton, Rio Tinto, and Brazil’s Vale, control two-third’s of global seaborne trade, and are already preparing for a recovery in China with higher output targets. Iron-ore is Brazil’s top export, shipping 23.5-tons in April, followed by 5.7-million tons of soy, and 2-million tons of crude oil.
Foreigners, including carry traders who leverage their bets in low-yielding currencies, such as the Japanese yen and US-dollar, now accounting for 36% of daily volume in Sao Paulo’s capital markets. “Money has no motherland; financiers are without patriotism and without decency; their sole object is gain,” – Napoleon Bonaparte. Brazil’s central bank has cut its Selic rate to a record low of 10.25% to reinvigorate its economy, but yields are still much higher than in G-7 nations.
Brazil’s broadest measure of inflation, the IGP-M price index, fell to 0.15% in April, which could allow the central bank to cut the Selic rate at its June meeting, and ultimately to 9.25% by year-end. That won’t deter “carry traders” who are focusing on Brazil’s crude oil, iron-ore, soy, and steel exports. Brazil’s currency, the real, has rebounded +14% to 47.2-US-cents since early March, its highest level in six-months, on hopes for a rebound in commodity markets.
But on May 5th, the Brazilian central bank surprised the currency markets, by soaking-up $3.4-billion of excess US-dollars, through a reverse currency swap, aimed at slowing the real’s advance. It was the first time the Bank of Brazil arranged a reverse swap since late September, which could help bolster its FX stash.
Gold whipsawed by Deflation risk in the Euro zone
There is a battle brewing within the European Central Bank, between two opposing camps, with different views of the risk of a deflation-trap, which could spell longer-term danger for the Euro-zone economy. Producer prices fell -0.7% in March to stand -3.1% lower than a year ago, reinforcing expectations the ECB would cut its repo rate by 25-basis points to 1% at its meeting on May 7th. The main driver behind the annual fall in producer prices was a 7.3% drop in energy costs.
“In the for-seeable future, the risk potential is to be seen on the side of deflation rather than inflation,” warned Bank of Austria’s chief Ewald Nowotny on May 5th. “The vicious cycle of deflation is not easy to overcome without drastic conventional and non-conventional measures, which several governments and central banks have adopted and continue to adopt,” added Bank of Cyprus’ Athanasios Orphanides.
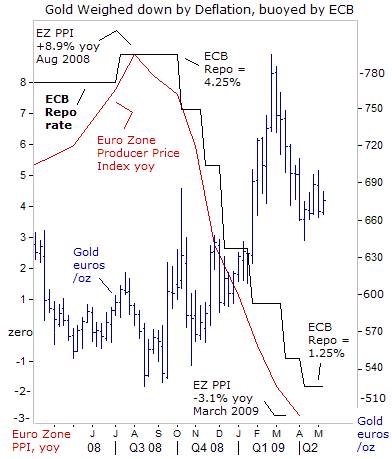 While central banks in England, Japan, and the US, have already started buying-up bonds with newly-printed money to supplement near zero-percent interest rates, ECB chief Jean-Claude Trichet has resisted “quantitative easing” (QE), and will lay out his thoughts at the May 7th news conference. Resisting the hallucinogenic drug of QE, are the Bundesbank’s Juergen Stark and Axel Weber, who point to historical evidence that pumping vast quantities of money into an economy leads to hyper-inflation, from Germany in the 1920’s to Argentina in the late 1980’s.
A damaging downward price-cycle is still seen as unlikely, but there is danger for the ECB in waiting too long to pull-out all the stops, if deflation takes root. In Spain, the Euro zone’s fourth largest economy, consumer prices fell for the first-time since records began in 1962, and the jobless rate jumped to a record 17.4-percent. Once the jobless rate spreads into the double-digits throughout the Euro-zone, consumers could recoil, and the risk of a vicious deflationary spiral jumps.
In the Euro-zone, gold prices have tumbled from a record high of 793-euros /oz set in February, to around 675-euros today, in reaction to a strong rebound in European banking shares. Austria’s Nowotny said the “bulk of the banking and financial crisis is over.” The ECB’s six rate cuts since October, totaling 300-basis points, coupled with liquidity injections in the interbank market, have subdued financial market turmoil.
Still, gold traders want to see if the ECB decides to start printing money, and expand its balance sheet through purchases of bonds or other assets. Although the risk of deflation in the Euro-zone is weighing on the yellow metal, - the prescription for fighting the disease – slashing interest rates to near zero-percent, and printing money to buy long-term bonds, is buoying gold.
How long can the global “Green-shoots” rally last? Are P/E’s artificially inflated due to the hallucinogenic side-effects of QE? What’s the long-term implication for interest rates, foreign currencies, gold, and the US Treasury bond market? The answers to these questions are included in the latest edition of Global Money Trends.
This article is just the Tip-of-the-Iceberg of what's available in the Global Money Trends newsletter, for insightful analysis and predictions of (1) top stock markets around the world, (2) Commodities such as crude oil, copper, gold, silver, and grains, (3) Foreign currencies (4) Libor interest rates and global bond markets (5) Central banker "Jawboning" and Intervention techniques that move markets.
By Gary Dorsch,
Editor, Global Money Trends newsletter
http://www.sirchartsalot.com
GMT filters important news and information into (1) bullet-point, easy to understand analysis, (2) featuring "Inter-Market Technical Analysis" that visually displays the dynamic inter-relationships between foreign currencies, commodities, interest rates and the stock markets from a dozen key countries around the world. Also included are (3) charts of key economic statistics of foreign countries that move markets.
Subscribers can also listen to bi-weekly Audio Broadcasts, with the latest news on global markets, and view our updated model portfolio 2008. To order a subscription to Global Money Trends, click on the hyperlink below, http://www.sirchartsalot.com/newsletters.php or call toll free to order, Sunday thru Thursday, 8 am to 9 pm EST, and on Friday 8 am to 5 pm, at 866-553-1007. Outside the call 561-367-1007.
Mr Dorsch worked on the trading floor of the Chicago Mercantile Exchange for nine years as the chief Financial Futures Analyst for three clearing firms, Oppenheimer Rouse Futures Inc, GH Miller and Company, and a commodity fund at the LNS Financial Group.
As a transactional broker for Charles Schwab's Global Investment Services department, Mr Dorsch handled thousands of customer trades in 45 stock exchanges around the world, including Australia, Canada, Japan, Hong Kong, the Euro zone, London, Toronto, South Africa, Mexico, and New Zealand, and Canadian oil trusts, ADR's and Exchange Traded Funds.
He wrote a weekly newsletter from 2000 thru September 2005 called, "Foreign Currency Trends" for Charles Schwab's Global Investment department, featuring inter-market technical analysis, to understand the dynamic inter-relationships between the foreign exchange, global bond and stock markets, and key industrial commodities.
Copyright © 2005-2009 SirChartsAlot, Inc. All rights reserved.
Disclaimer: SirChartsAlot.com's analysis and insights are based upon data gathered by it from various sources believed to be reliable, complete and accurate. However, no guarantee is made by SirChartsAlot.com as to the reliability, completeness and accuracy of the data so analyzed. SirChartsAlot.com is in the business of gathering information, analyzing it and disseminating the analysis for informational and educational purposes only. SirChartsAlot.com attempts to analyze trends, not make recommendations. All statements and expressions are the opinion of SirChartsAlot.com and are not meant to be investment advice or solicitation or recommendation to establish market positions. Our opinions are subject to change without notice. SirChartsAlot.com strongly advises readers to conduct thorough research relevant to decisions and verify facts from various independent sources.
Gary Dorsch Archive |
© 2005-2022 http://www.MarketOracle.co.uk - The Market Oracle is a FREE Daily Financial Markets Analysis & Forecasting online publication.


