What's Next for Silver?
Commodities / Gold & Silver May 20, 2007 - 11:57 AM GMTBy: Roland_Watson
So silver has once again renewed its acquaintance with the 200 day moving average and the dirges regarding the death of a silver bull renew their solemn chants.
Why the fear and concern amongst silver analysts and silver investors in general? Various indicators suggest a potential breakdown in prices with bearish connotations. Now that raises one or two questions themselves. For one, what constitutes the end of a bull market?
That rather depends on your timeframe. One could easily argue silver has been in a bear market since Friday the 12th May 2006 as prices have drifted below the $15 high of that time. On the other hand, silver has not looked back since March 2003 when it traded for less than $4.50 giving us a full-blooded bull market whose demise is not on the cards quite yet. It depends on your timeframe, but nothing in the recent price action suggests the end of the silver bull market.
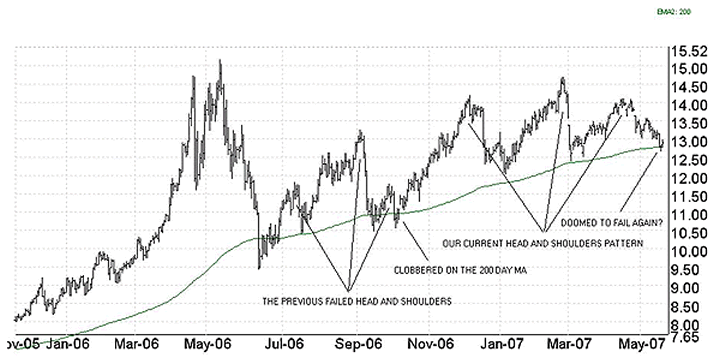
The other worrisome factor is the head and shoulders pattern that has developed in silver since last November. The chart below shows that unfolding pattern which has caused some analysts to reach for the "s", "e", "l" and "l" keys. However, we may point out another head and shoulders pattern that developed in silver in October 2006.

Like our current head and shoulders, this one touched the 200 day moving average only to be swatted like a fly before it got ideas above its station. Shall we see a repeat performance? I say most likely especially with silver so oversold as it is with not much room for further downside action. I suspect silver may drop further but a drop to $9 or $10 seems less likely on past performance.
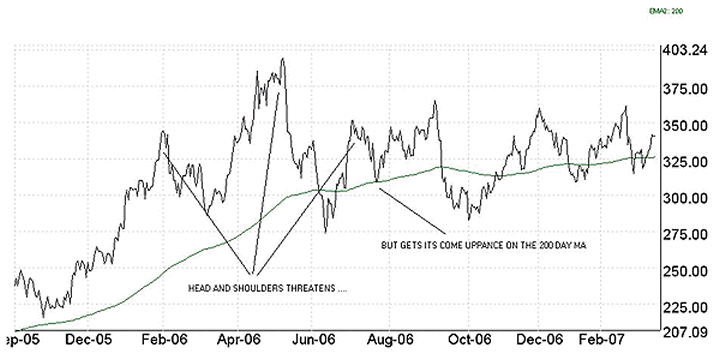
In fact, failed head and shoulder patterns were not particularly difficult to find. Here is one for the HUI from about the same period, which also floundered on the rocks of the 200-day moving average.

But do not let me delude you into thinking that this means the silver ICBM is about to be unleashed from its silo to nuke the bears. I said the following a month ago in a previous article regarding certain price patterns in silver:
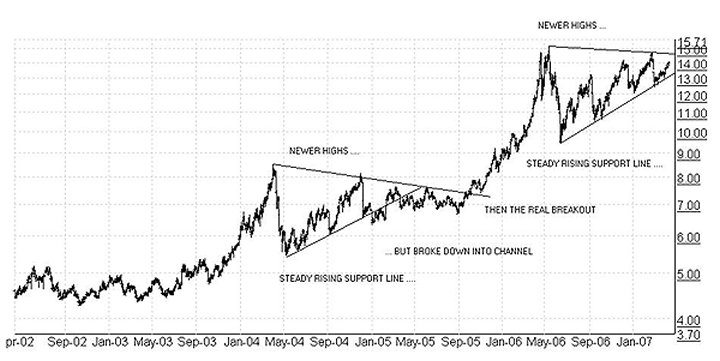
That brings me to some observations on the vagaries of analyzing price trends. As some commentators have pointed out, silver has been advancing on a rising support level, which can be drawn across the sequence of increasingly higher lows. That sounds bullish and it may yet prove to be but an analysis of the last good sized correction in silver between April 2004 and August 2005 suggests caution. The chart is attached to this email for you to follow ( see below ).
Note how after the big drop in April 2004, silver also advanced in a similar fashion to our current moves on a rising trend line until the old highs of $8.50 were nearly taken out in December 2004. However, this trend broke to the downside to begin a channel movement for silver for some months before the true breakout occurred in September 2005.
Will our current rising trend line support the price of silver or will we see a temporary breakdown? That previous rising trend line lasted 8 months. This current one has lasted 10 months. Once again, a breaking of the previous high of late February is required to maintain the bullish sequence of higher highs and invalidate that analysis.

Two things came true regarding those statements. The caution regarding faith in rising support lines proved right, as we have now broken below that rising support line. Secondly, I said the old February highs had to be taken out to be bullish. That high was not exceeded and we entered our current period of bearish price behaviour.
So what next for silver? There are three opinions you can take on this matter. You can sell up and declare the bull dead. Or you can say that silver will rocket from its 200 day moving average base to $15 and beyond. The third opinion based on the last major correction is that silver will move sideways before the next and final bull run begins. Since the silver analysis game is all about probabilities rather than certainties, I would bet on the sideways motion being more likely followed by the explosive breakout. I just hope any sideways motion does not last as long as the previous one! More information on how things may pan out for silver follows for subscribers.
By Roland Watson
http://silveranalyst.blogspot.com
Further analysis of the SLI indicator and more can be obtained by going to our silver blog at http://silveranalyst.blogspot.com where readers can obtain the first issue of The Silver Analyst free and learn about subscription details. Comments and questions are also invited via email to silveranalysis@yahoo.co.uk .
© 2005-2022 http://www.MarketOracle.co.uk - The Market Oracle is a FREE Daily Financial Markets Analysis & Forecasting online publication.


