


Gold on the Launch Pad
Commodities / Credit Crisis 2009 May 01, 2009 - 12:55 AM GMTBy: Guy_Lerner

 I love to chronicle my follies with gold. Gold seems so easy. The Federal Reserve runs the printing presses, and everyone in the world knows this is inflationary, and just like that, gold should be off and running. But it isn't.
But in retrospect, my gold exhortations haven't been so bad. Back in August, 2008, I was less sanguine about gold primarily because I was bullish on the Dollar. When others were bullish on gold back in February, 2009 -as in we are "going to the moon, Alice!" - I was stating that this was not the set up where gold should go higher. This too was a good call. The best I could muster was that gold would remain range bound.
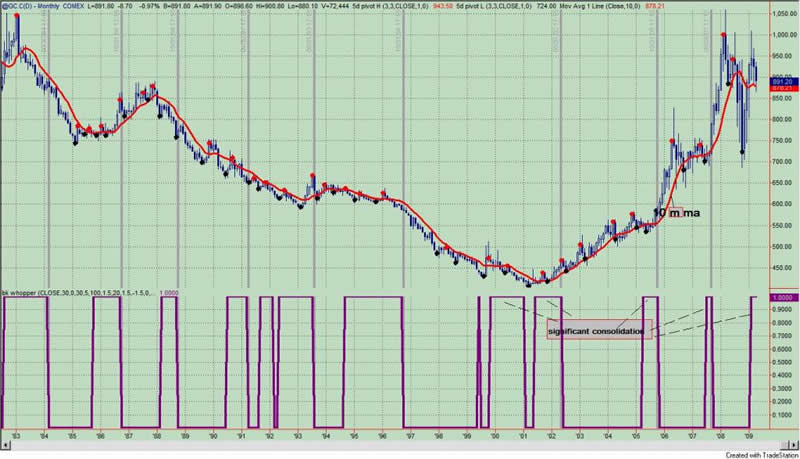
And range bound it has been, and we can see that in figure 1, which is a monthly price chart of a continuous gold contract. The indicator in the lower panel measures the degree to which prices have become compressed, and presently, gold prices are compressed to a statistically significant degree.
Figure 1. Gold/ monthly
What we do know is this: compressed prices can lead to explosive moves in either direction.
So this period of consolidation in gold (and most other assets) meets my criteria for a set up that can act as a launching pad for higher prices. But it can also be a launching pad for lower prices, too.
And that is the dilemma. I wish I had an answer, but any technical indicator that I have for you would only be curve fitting in my opinion. But all is not lost as the current set up offers a low risk entry for going long gold.
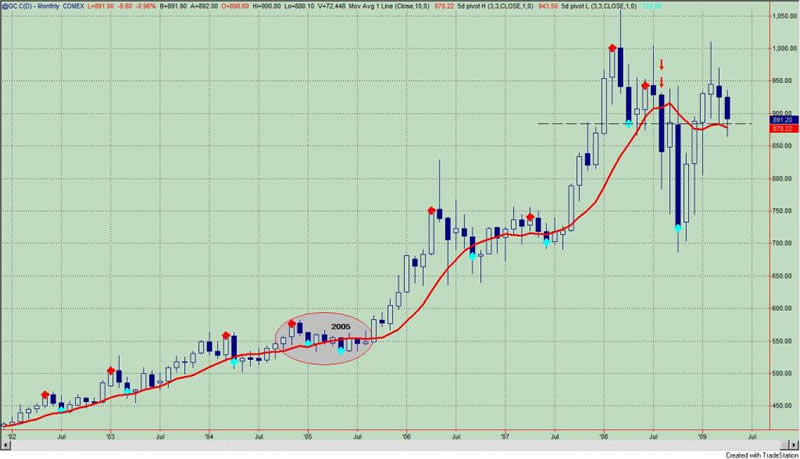
So let's take another look at the monthly price chart for gold. See figure 2. As long as prices stay above the pivot low at $884.80 on a monthly closing basis, I can remain constructive on gold. Gold is now trading in the low end of its range. When the bull market in gold began in July, 2001, gold has (almost) always closed above its prior pivot low point; this is a hallmark of a bull market -higher lows. The lone exceptions to this rule are: 1) highlighted in the oval when the price of gold closed below the prior pivot for only one month before moving significantly higher and 2) highlighted by the red down arrows as this was the close below the prior pivot low point that effectively "killed" the bull market.
Figure 2. Gold/ monthly
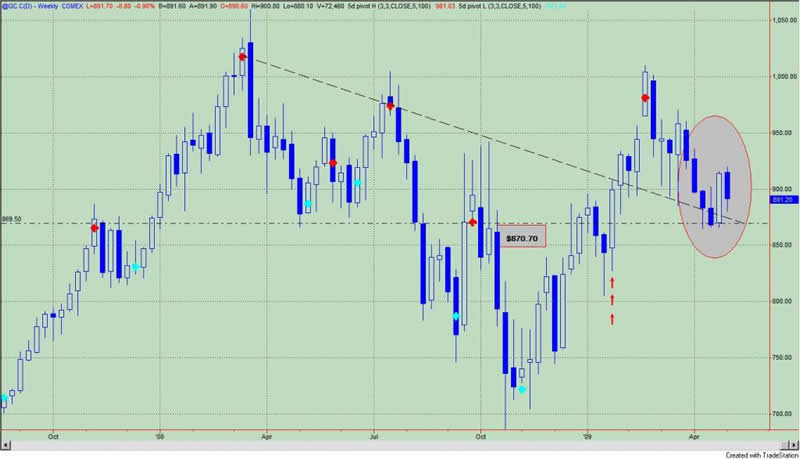
Now let's look at a weekly chart of a continuous gold contract. See figure 3. The breakout (price bar with red arrows) above the down sloping trend line has pulled back to support levels of the down sloping trend line and the pivot high. This looks like a retest of the breakout (inside the oval), and in my "textbook" this represents a low risk entry point. On this weekly view, a weekly close below $870.70 would like lead to lower prices.
Figure 3. Gold/ weekly
So let's summarize. Gold is on the launching pad; gold is trading within a range and it is at the lower end of that range. We accept the fact that we cannot predict the direction gold will take. Prices could either breakout or breakdown from this range. Once we accept this condition, I believe that the current price represents a low risk, well defined entry point. A monthly close below $884.40 is bearish; on the SPDR Gold Trust (symbol: GLD) this pivot comes in at $86.65. A weekly close below $870.70 is bearish as well; for the GLD this pivot is at $85.12.
By Guy Lerner
http://thetechnicaltakedotcom.blogspot.com/
Guy M. Lerner, MD is the founder of ARL Advisers, LLC and managing partner of ARL Investment Partners, L.P. Dr. Lerner utilizes a research driven approach to determine those factors which lead to sustainable moves in the markets. He has developed many proprietary tools and trading models in his quest to outperform. Over the past four years, Lerner has shared his innovative approach with the readers of RealMoney.com and TheStreet.com as a featured columnist. He has been a regular guest on the Money Man Radio Show, DEX-TV, routinely published in the some of the most widely-read financial publications and has been a marquee speaker at financial seminars around the world.
© 2009 Copyright Guy Lerner - All Rights Reserved
Disclaimer: The above is a matter of opinion provided for general information purposes only and is not intended as investment advice. Information and analysis above are derived from sources and utilising methods believed to be reliable, but we cannot accept responsibility for any losses you may incur as a result of this analysis. Individuals should consult with their personal financial advisors.
Guy Lerner Archive |
© 2005-2022 http://www.MarketOracle.co.uk - The Market Oracle is a FREE Daily Financial Markets Analysis & Forecasting online publication.