


ETF Chart Trend Comparisons
Stock-Markets / Investing 2009 Apr 27, 2009 - 10:21 AM GMTBy: Richard_Shaw

 We present three tables comparing the charts of investment funds based on several criteria that some investors may find useful when interpreting whether the fund is in an uptrend or downtrend. The charts used are multi-year, weekly charts. The criteria range from aggressive to conservative tests for trend.
Note that we do not present these as dispositive of opportunity. They are simply additional data to consider as part of your determination of entry or exit points on funds that you have otherwise determined are what you want to own for conceptual and fundamental reasons, and that you have determined by other means to be reasonably valued and not subject to risks beyond those you are willing and able to take.
Note also that the criteria we used to test for trend are not the only ones we use or that others use. They are just ones that are uncomplicated in nature and that could be interesting and helpful to some of our readers in their larger research effort.
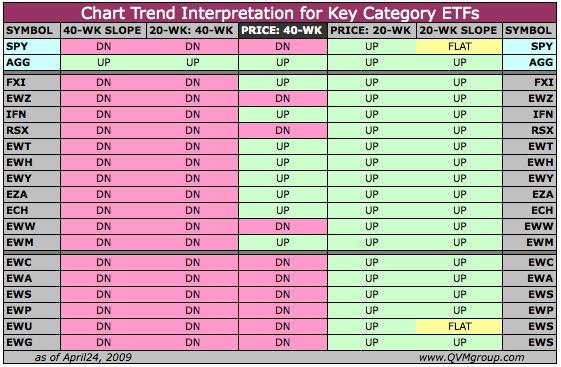
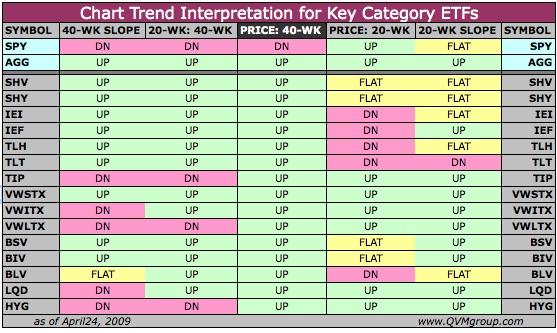
One table compares funds for twelve key asset categories from which a reasonable total portfolio could be constructed. Another compares selected country funds. The other compares funds for key bond types.
Each fund is interpreted by these criteria:
- Is the slope of the 40-week simple moving average up, down or flat?
- Is the 20-week simple moving average above or below the 40-week simple moving average (above labeled UP, below labeled DN)?
- Is the price above or below the 40-week simple moving average (above labeled UP, below labeled DN)?
- Is the price above or below the 20-week simple moving average (above labeled UP, below labeled DN)?
- Is the slope of the 20-week simple moving average up, down or flat?
The designation “flat” is based on the slope of the last week or two to look for a flattening or topping out pattern.
To make it a bit easier to see how the funds compare, cells with UP have a green background, cells with DN have a pink background, and cells with FLAT have a yellow background.
For each table, SPY and AGG, representing important stock and bond benchmarks, are shown at the top for easy visual benchmark comparison.
The key asset category funds are:
- VTI: total US stocks
- VGK: developed Europe stocks
- EPP: developed Asia stocks
- EWJ: Japan
- EEM: emerging markets stocks
- IEF: intermediate US Treasuries (7-10 years)
- LQD: investment grade corporate bonds
- JNK: below investment grade corporate bonds
- MUB: national municipal bonds
- DBC: global commodities basket
- IYR: US equity REITs
- TIP: inflation protected US Treasuries
The selected countries funds are:
- FXI: China
- EWZ: Brazil
- IFN: India
- RSX: Russia
- EWT: Taiwan
- EWH: Hong Kong
- EWY: Korea
- EZA: South Africa
- ECH: Chile
- EWW: Mexico
- EWM: Malasia
- EWC: Canada
- EWA: Australia
- EWS: Singapore
- EWP: Spain
- EWU: United Kingdom
- EWG: Germany
The key bond category funds are:
- SHV: US Treasuries < 12 mo
- SHY: US Treasuries 1-3 yr
- IEI: US Treasuries 3-7 yr
- IEF: US Treasuries 7-10 yr
- TLH: US Treasuries 10-20 yr
- TLT: US Treasuries 20+ yr
- TIP: inflation protected US Treasuries
- VWSTX: short-term national municipal bonds
- VWITX: intermediate-term national municipal bonds
- VWLTX: long-term national municipal bonds
- BSV: short-term component of US aggregate bonds
- BIV: intermediate component of US aggregate bonds
- BLV: long-term component of US aggregate bonds
- LQD: investment grade corporate bonds
- HYG: below investment grade corporate bonds


By Richard Shaw
http://www.qvmgroup.com
Richard Shaw leads the QVM team as President of QVM Group. Richard has extensive investment industry experience including serving on the board of directors of two large investment management companies, including Aberdeen Asset Management (listed London Stock Exchange) and as a charter investor and director of Lending Tree ( download short professional profile ). He provides portfolio design and management services to individual and corporate clients. He also edits the QVM investment blog. His writings are generally republished by SeekingAlpha and Reuters and are linked to sites such as Kiplinger and Yahoo Finance and other sites. He is a 1970 graduate of Dartmouth College.
Copyright 2006-2009 by QVM Group LLC All rights reserved.
Disclaimer: The above is a matter of opinion and is not intended as investment advice. Information and analysis above are derived from sources and utilizing methods believed reliable, but we cannot accept responsibility for any trading losses you may incur as a result of this analysis. Do your own due diligence.
Richard Shaw Archive |
© 2005-2022 http://www.MarketOracle.co.uk - The Market Oracle is a FREE Daily Financial Markets Analysis & Forecasting online publication.