


JP Morgan Collapse Could Trigger Next Global Stock Market Crash
Stock-Markets / Financial Crash Apr 27, 2009 - 12:34 AM GMTBy: Brian_Bloom

 In summary, this article concludes that the probability of another stock market crash within the foreseeable future is very high. The word “crash” is used advisedly. Since early March 2009, the industrial equity markets have been rising on misplaced hope. When that hope is dashed – as looks highly probable – the consequence is likely to be a wave of selling pressure given that the credibility of the financial authorities will have been shattered.
***************
At the heart of the modern financial “Establishment” lies JP Morgan. This is not a Conspiracy Theorist statement. It is a statement of fact. According to some, JPM is the biggest player in the Derivatives industry, world-wide. Figures of between $600 trillion and a Quadrillion dollars have been bandied about by those who seek to quantify the size of that industry. It really doesn’t matter which number is more accurate. To this analyst, both numbers are equally mystifying so let’s just stay focused on the principle, which is this: Where goes JPM, there goes the US (and, possibly, the World) economy.
For this reason, the fundamental and technical health of JPM is critically important.
The following is reproduced from a very enlightening article by Marty Weiss, which can viewed at http://www.marketoracle.co.uk/Article10139.html
“Meanwhile, based on fourth quarter Fed data, we find that, among the nation’s megabanks, six are at risk of failure in our opinion (seven if you count Wachovia and Wells Fargo as separate institutions).
JPMorgan Chase is the nation’s largest, with $1.7 trillion in assets in its primary banking unit. It’s massively exposed to defaults by its trading partners in derivatives — to the tune of 382 percent (almost four times) its risk-based capital. Plus, since it holds HALF of ALL the derivatives in the U.S. banking industry, JPMorgan is at ground zero in the debt crisis. “
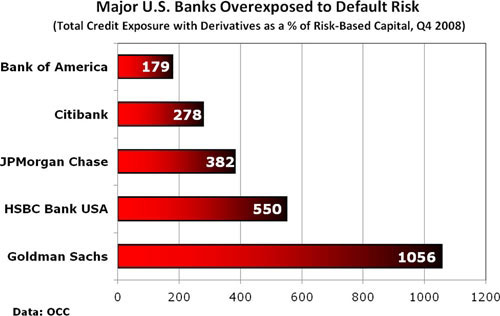
I’m not sure how Marty arrives at the 382% number given that he also makes the statement that JPM holds half of all the derivatives in the US banking industry. Perhaps he is looking at its exposure to a selected group of its counterparties. Once again, in my view, the exact numbers are probably not relevant. The principle on which I am focusing appears to be the same principle on which Marty is focusing, namely: If any one of the big Derivatives players goes belly up, there will very likely be a domino effect; they will all go belly up. In particular, JPM’s numbers are so large as to dwarf the ability of the US Government and/or Federal Reserve System to plug the hole that JPM alone will create – were it to go belly up.
So, with the fundamental risk so huge, what is the probability that this risk will turn into a reality? To answer this question, we have to turn to technical analysis.
The charts below – courtesy Bigcharts.com – tell the story:
Chart 1 – JPM Monthly chart
Something appears to have changed in around 1995 and leading up to 2000. The price of JPM sextupled. Those were the Greenspan years leading up to the anticipated Y2K “crisis” which never happened. In 2007, volume started to spike, and this volume clearly had a selling bias given that the price was in a bear trend during the period of extraordinarily high volume. The accumulation from 1995 to 2007 turned into distribution.
Conceivably, because the blue MACD line appears to have bottomed at a higher level than the 2002 bottom there are some who might argue that, therefore, the primary direction of JPM’s share price is about to change from “down” to “up”. This argument would be reinforced by the fact that the Rate of Change (ROC) oscillator has bottomed and has been rising in recent months. Arguably, if/when the ROC oscillator breaks above the zero line, price can be expected to continue rising – just as it did in the 2003 period and then again in 2006.
Which brings us to:
Chart 2 – JPM Weekly Chart
Unfortunately, based on this chart, the ROC oscillator on the monthly chart is less likely to break above the zero line than it is to bounce down off the zero line. The reason for this is that the ROC on this weekly chart is in deep “overbought” territory. Furthermore, the MACD oscillator appears to want to turn down. There are two interesting facts about this MACD oscillator:
- The black “divergence” oscillator has only been in positive territory for a very small proportion of the preceding 5 years. This is the mark of a share price which has been in a Primary Bear trend
- The Moving Averages of the divergence are still in deeply negative territory. What this means is that the “spike” in JPM’s price has been extraordinarily quick and it has outrun its moving averages. Under such circumstances, a pullback in price is virtually inevitable.
Interim Conclusion
The price of JPM is more likely to fall from this level than it is to rise.
Chart 3: JPM – Daily Chart
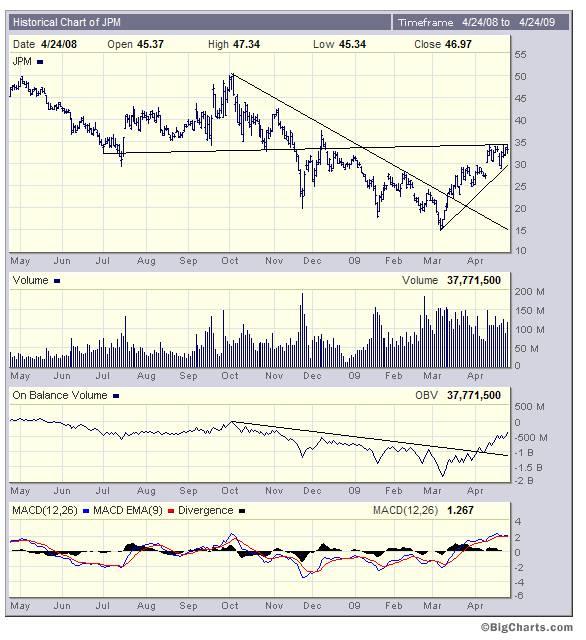
This chart is particularly worrying and, in this analyst’s view, is screaming warning signals.
The most important overall observation that can be made is that the daily price of JPM is encountering a string of resistance to further rises.
- The almost horizontal trend line has been drawn in based on a subjective assessment by this analyst who has come to understand over the years that “gaps” in bar charts are very important. They occur when emotions run high. The reader’s attention is drawn to the downside gap that manifested in December 2008. In drawing the trend line, I attempted to join as many points of contact, with the upper price of the gap being one of them. The result was that the trend line thus drawn landed up at a point where the current price appears to be bouncing down. Importantly, this trend line has not yet been penetrated on the upside even though there have been five attempts in the past few days. (Note: Of course, if the trend line is penetrated on the upside in the next few days I will change my view but, right now, the “fact” is that the trend line remains intact.)
- The MACD moving averages are in rarified overbought territory and look like they want to pull back. This needs to be seen in context of decreasing peaks in the black “divergence” oscillator – which is not typically a bullish sign.
- Most compelling of all, the On Balance Volume chart – whilst in a strong uptrend – is approaching the resistance of the zero level.
To this analyst, this last observation offers perhaps the most important clue to the future direction of JPM’s share price.
Let’s backtrack a bit and look at a bigger picture of the JPM’s OBV.
The chart below goes all the way back to the year 1999, at which point the OBV starts off at zero
Chart 4 – JPM Daily Chart 1999 - 2009
What we see here is that, over the ten year period under review, the volume of shares traded in JMP has, On Balance, been associated with selling pressure. The OBV started off at zero and has landed up below zero. On balance, there has been an absence of the buying pressure that will be needed to change the direction of the Primary Trend.
Given this unarguable fact, and given the fact that the interim conclusion above is that the price of JPM is more likely to fall from this level than it is to rise, we now need to focus on the core implication, which is this:
The trillions of dollars of “stimulation” on the part of the financial authorities have been unable to impact on the Primary Trend of the share price of the most important banking institution in the world – which seems almost certain to remain in a Primary Bear Trend.
And this brings into sharp focus the risks associated with what the authorities have been doing. In an attempt to preserve the “illusion” of confidence, the authorities have been creating a tidal wave of money. If the markets now start to turn down again – after this Herculean attempt to reverse the trend – what do we think will be the impact on investor confidence?
There are those who are arguing that this tidal wave of money will almost certainly give rise to hyperinflation and that, therefore, the price of “everything” will rise.
In this analyst’s opinion, this argument is too broad brush. If hyperinflation (or any inflation for that matter) is going to manifest, it will be in US dollar denominated prices. The US only accounts for roughly 25% of the world’s economy.
The evidence seems to be pointing to the possibility that the US Dollar will soon come under pressure and, if the dollar falls strongly then, yes, the prices of dollar denominated commodities and other assets will certainly rise.
The chart below shows what happened to the US Dollar last week. (Courtesy DecisionpPoint.com)
Chart 5 – US $ Index – Daily Chart
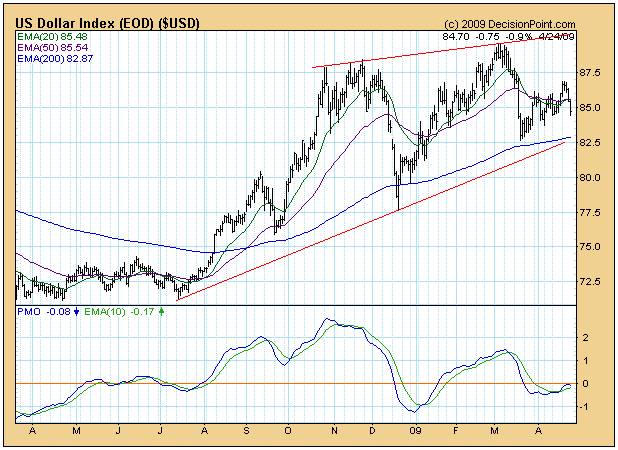
Apart from the fact that the US Dollar Index fell strongly on Friday, the more important fact is that the PMO oscillator pulled back from the zero line.
In this analyst’s view, it has not been the fear of inflation that has caused the yield on the long bond rate to spike upwards, as can be seen from the chart below, it has been the fear of a collapsing dollar.
Chart 6 – 30 Year Bond Yield – Daily Chart
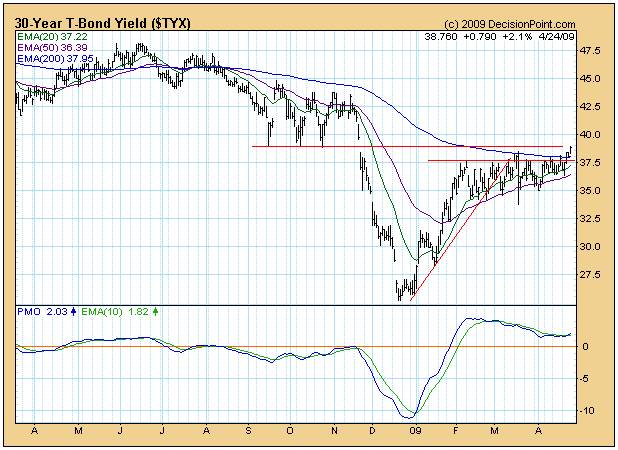
Let there be no misunderstanding. This is an ominous development. Rising interest rates are likely to be symptomatic of a coming cash crunch, because if the trillions of dollars of stimulus haven’t worked up to now, there will be no purpose to be served (as Mrs Merkel in Germany has concluded) in continuing down this path.
Unfortunately, if there is a cash crunch, the flip side of this is that the revenue streams of the embattled banks are likely to dry up and, given that the raison d’etre of a bank is to borrow and lend money, this has serious implications for the already unhealthy bank balance sheets – of which JPM’s is the lynchpin (to say nothing of the implications to commerce and industry in general).
Comment
Given the state of play in the world economy and the enormous importance of JPM within the banking industry, the future direction of JPM’s share price is very likely to point the future direction of the entire world’s economy.
The charts are virtually unanimous that JPM’s share price is very vulnerable at present and is more likely to fall than to rise.
Given the vulnerability of the US Dollar (by far the largest component of the currency markets) and of the bond markets (by far the largest repository of investment capital) the future direction of JPM’s share price is of enormous importance. The fact is that JPM is the largest player in the Derivatives Industry – where most derivatives are for the purpose of protecting against future movements in currencies and/or interest rate movements. The probability is that, if JPM is the largest player in the Derivatives markets, it will more likely lose money than make money if the dollar collapses and interest rates rise. Very likely, it is on the wrong side of those bets and, being the largest player, will not have a balanced book of buy and sell orders.
Remember the domino effect. If JPM goes, the other big banks will very likely fall too. Sight should not be lost of the fact that the banking industry is sitting on a mountain of debt owed to it. If that debt mountain implodes, inflation will be the least of our worries.
Overall Conclusion
The world’s financial authorities have done what they could and have shot their bolt. The equity markets, having rallied strongly, are now giving signals of an impending downturn – thereby confirming that the Primary direction of the markets is Bearish.
Against a background of previously mounting investor hope, this reinforcement of the direction of the trend is likely to turn the hope into exaggerated fear. It is the expectation of this analyst that we will witness a mind numbing collapse in equity prices within the foreseeable future as previously hopeful investors begin to panic.
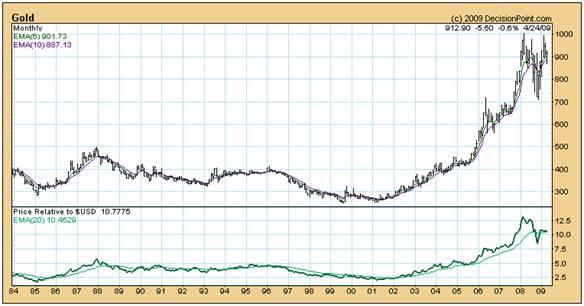
For purely emotional reasons, it seems likely that the flip side of this will be an upward explosion in the gold price. It is certainly within the bounds of technical possibility that the chart of the gold price could enter a parabolic phase. The “theoretical” upside limit of the gold price is trending towards $15,000 an ounce. Unless we change our Thought Paradigms entirely, that is where it will get to if the world’s financial system is to have any chance of survival.
Author’s Comment
New readers of this analyst’s work might form the view that the above conclusions are a tad hysterical to say the least. To the contrary, they flow from cold reason. For reasons which have been clearly and consistently articulated by this analyst in his various editorials over a period of more than seven years – and as are highlighted in his far more light hearted (than this article) novel, Beyond Neanderthal, it seems that the best possible way to secure humanity’s collective future is to structurally change our Thought Paradigms. This time, because we have passed Peak Oil, it really is different. We have to stop dickering around with “niche” alternative energies like biofuels and geothermal energy. We need to commercialize an electricity storage technology which is an order-of-magnitude more powerful than current battery technologies. This will legitimize both solar and wind energy technologies. One possible storage technology of this nature is described in Beyond Neanderthal. We need to shift our entire industrial, commercial and transport infrastructures away from their dependence on fossil fuels.
Finally, we need to stop being so dogmatic about what will and will not replace fossil fuels and we should seriously investigate all alternatives, including those which claim to offer over-unity energy outputs relative to inputs. If the over-unity claims turn out to be spurious, then the transport world probably needs to embrace hydrogen because of its transportability rather than electric cars that plug into grids that seem likely to become increasingly vulnerable over time. At face value, the over-unity claims may not be spurious. Cutting edge science is gaining a more in-depth understanding of environmental energy. It has been demonstrated mathematically that by far the largest component which makes up our Universe is so-called “dark” energy; energy which cannot be physically detected. Perhaps the laws of thermodynamics need to be augmented by a fourth law which takes this latter fact into account. If we want to survive, we need to keep our minds wide open to all possibilities.
By Brian Bloom
Beyond Neanderthal is a novel with a light hearted and entertaining fictional storyline; and with carefully researched, fact based themes. In Chapter 1 (written over a year ago) the current financial turmoil is anticipated. The rest of the 430 page novel focuses on the probable causes of this turmoil and what we might do to dig ourselves out of the quagmire we now find ourselves in. The core issue is “energy”, and the story leads the reader step-by-step on one possible path which might point a way forward. Gold plays a pivotal role in our future – not as a currency, but as a commodity with unique physical characteristics that can be harnessed to humanity's benefit. Until the current market collapse, there would have been many who questioned the validity of the arguments in Beyond Neanderthal. Now the evidence is too stark to ignore. This is a book that needs to be read by large numbers of people to make a difference. It can be ordered over the internet via www.beyondneanderthal.com
Copyright © 2009 Brian Bloom - All Rights Reserved
Disclaimer: The above is a matter of opinion provided for general information purposes only and is not intended as investment advice. Information and analysis above are derived from sources and utilising methods believed to be reliable, but we cannot accept responsibility for any losses you may incur as a result of this analysis. Individuals should consult with their personal financial advisors.
Brian Bloom Archive |
© 2005-2022 http://www.MarketOracle.co.uk - The Market Oracle is a FREE Daily Financial Markets Analysis & Forecasting online publication.