


Gold, Silver and The Dow Jones Index
Stock-Markets / Gold & Silver May 18, 2007 - 08:58 AM GMT

This article examines the current Silver market, Gold market and the Dow Jones Industrial average from a big picture perspective. As always our material is kept simple and easy to understand as we think simplicity is the secret to success.
A picture speaks a thousand words. We think a major macro market trend has been underway since about 2000, and this trend will not stop until an extreme is met in the direction traveled. This trend will take breaks, it will not proceed in a straight line, but ultimately we believe it will continue in the direction it is headed.
When we take the Dow Jones and divide it by the price of Gold we get an analysis tool called the Dow/Gold Ratio. Because US stocks are priced in US dollars and the price of gold is priced in US dollars, creating this ratio cancels out the common denominator of the US dollar and compares these markets directly. When we compare the markets directly, we see which market is outperforming the other market. When the black line heads higher, the Dow Jones is performing better, when the black line heads lower, gold is performing better. In the short term this can look like noise. In the long term it can describe a very clear story.
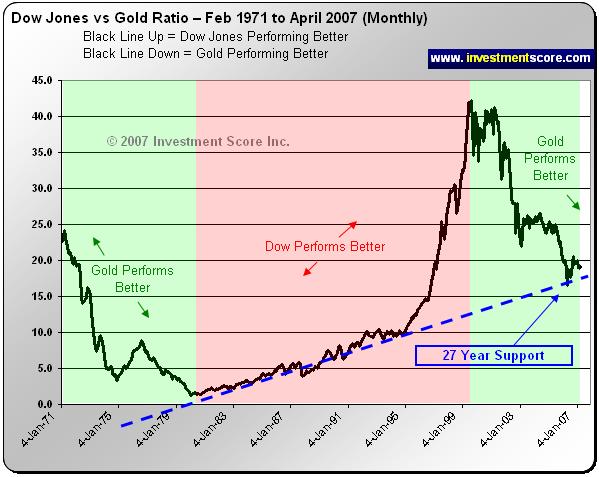
• You will notice when the black line is heading up the Dow Jones is generally outperforming the price of gold. We shaded the general trend of the Dow Jones bull market in red. From about 1980 to 2000 the Dow Jones was very clearly in a bull market and outperforming the price of gold. During this time it would be logical to heavily weigh ones investments in the Dow Jones index.
• You will notice that in 2000 the price of gold started to outperform the Dow Jones. In 2000 the Dow Jones gold ratio peaked at about 42 and then started to head lower. This means that in about 2000 it took 42 ounces of gold to buy one share of the Dow Jones index. But in 2007 it only takes about 19 ounces of gold to buy one share of the Dow Jones index. In other words, since 2000 the price of gold has been outperforming the Dow Jones Index. During this time period it would have made sense to invest in gold. We shaded this area in green.
• In a bull market we regularly experience quick price advances followed by a sharp pullback. This is normal market behavior. This is a lot of short term noise that intimidates, frustrates and costs many investors a lot of money. Notice the long term dotted trend line we drew on the graph above. This trend line extends back from about 1980 to about 1995, where the Dow Jones really took off. This line is significant as it illustrates a major support line for the Dow/Gold Ratio. Note how in May of 2006 the ratio bounced on the exact same support line that had been started 27 years earlier. In our opinion this is extremely important. We think that the bull market slowing down on this long term support line is normal bull market action. We also think the long term trend will eventually continue and this support line will be broken. This is important because once this support line is broken we expect gold to race higher. We do not expect the Dow/Gold ratio to end until the black line heads much lower and an extreme is met in the direction traveled.
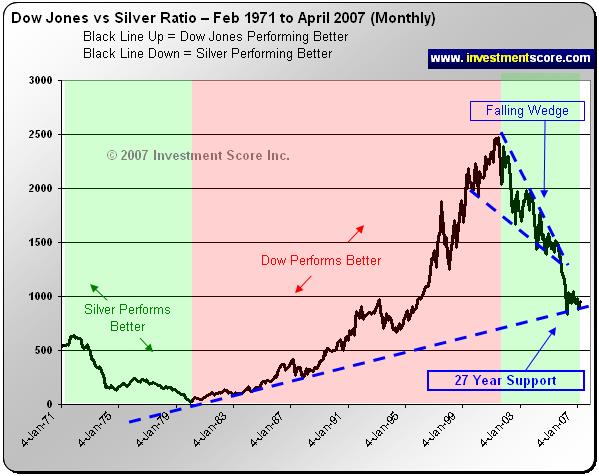
Looking at the Dow/Silver Ratio graph is equally fascinating.
• The Dow Jones outperformed the price of silver from about 1980 until about July of 2001. We shaded this Dow Jones advance in red.
• Silver did not start to advance quicker than the Dow Jones until about two years after gold did. However, once this advance started, it appears to be more aggressive as the black line drops very quickly. Notice the falling wedge outlined with dotted lines on the chart above and how the price of silver bearishly broke to the down side of this massive five year forming wedge.
• Once again, the Silver/Dow ratio has a similar support line that existed in the Gold/Dow ratio. This twenty seven year line has stalled this advance as should be expected; but once this major support line is broken we expect a significant advance in the precious metals markets.
We favor silver over gold for many fundamental reasons. On our website www.investmentscore.com we have outlined many reasons to invest in silver. The above chart is just one more example of why we favor silver over gold.
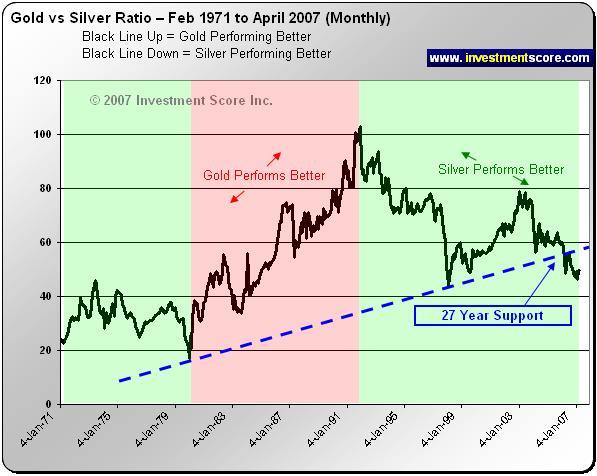
What is significant about all three of these charts is how clearly the trends appear. When you look at the long term trends, the day to day price movements become nearly irrelevant. In the chart above, gold outperformed silver from about 1980 to about 1991. In 1991 to roughly the present time, silver started to outperform gold. A similar long term trend line has been broken in this ratio. This break in the long term trend leads us to believe that silver will continue to outperform gold in the coming years.
We constantly stress the importance of the big picture so that an investor may see the full story. In the big picture you can follow the plot and not get distracted by the minor details. Investing does not have to be complicated. In our opinion investing can be simple, slow moving and relatively easy to understand.
We think that the major long term trend is to favor commodities outperforming the general US stock markets. In addition to this analysis we expect silver to outperform gold in the coming years. We believe the major trends are underway and these major trends will not end until an extreme is met in the direction traveled. At this point in the commodities bull market we do not see evidence of an extreme in either our charts or in our fundamental analysis of the markets.
Investmentscore.com is the home of the Investment Scoring & Timing Newsletter. Through our custom built, Scoring and Timing Charts , we offer a one of a kind perspective on the markets.
Our newsletter service was founded on revolutionary insight yet simple principles. Our contrarian views help us remain focused on locating undervalued assets based on major macro market moves. Instead of comparing a single market to a continuously moving currency, we directly compare multiple major markets to one another. We expect this direct market to market comparison will help us locate the beginning and end of major bull markets and thereby capitalize on the largest, most profitable trades. We pride ourselves on cutting through the "noise" of popular opinion, media hype, investing myths, standard over used analysis tools and other distractions and try to offer a unique, clear perspective for investing.
Disclaimer: No content provided as part of the Investment Score Inc. information constitutes a recommendation that any particular security, portfolio of securities, transaction or investment strategy is suitable for any specific person. None of the information providers, including the staff of Investment Score Inc. or their affiliates will advise you personally concerning the nature, potential, value or suitability or any particular security, portfolio of securities, transaction, investment strategy or other matter. Investment Score Inc. its officers, directors, employees, affiliates, suppliers, advertisers and agents may or may not own precious metals investments at any given time. To the extent any of the content published as part of the Investment Score Inc. information may be deemed to be investment advice, such information is impersonal and not tailored to the investment needs of any specific person. Investment Score Inc. does not claim any of the information provided is complete, absolute and/or exact. Investment Score Inc. its officers, directors, employees, affiliates, suppliers, advertisers and agents are not qualified investment advisers. It is recommended investors conduct their own due diligence on any investment including seeking professional advice from a certified investment adviser before entering into any transaction. The performance data is supplied by sources believed to be reliable, that the calculations herein are made using such data, and that such calculations are not guaranteed by these sources, the information providers, or any other person or entity, and may not be complete. From time to time, reference may be made in our information materials to prior articles and opinions we have provided. These references may be selective, may reference only a portion of an article or recommendation, and are likely not to be current. As markets change continuously, previously provided information and data may not be current and should not be relied upon.
© 2005-2022 http://www.MarketOracle.co.uk - The Market Oracle is a FREE Daily Financial Markets Analysis & Forecasting online publication.