


S&P 500 Stock Index Price Level and GDP Growth Rate
Stock-Markets / Stock Index Trading Apr 24, 2009 - 05:51 PM GMTBy: Richard_Shaw

 Based on US and world nominal GDP growth rates from 1981 through 2008, we make a case for the likely price of the S&P 500 between 650 and 800.
The Facts:
One problem with financial analysis is the mixing of facts with opinions and failing to note which is which. To try to avoid that problem, this section contains only what we would call facts — actual historical index prices and actual compound growth rates between prices over various periods; and actual US and world GDP levels and the compound growth rates between them over various periods.
Let’s begin with US and world GDP figures.
From year-end 1981 through year-end 2008, the compound annual growth rate (”CAGR”) of US nominal GDP was 5.78%. The real GDP growth rate was 2.96%.
From year-end 1981 through year-end 2008, the CAGR of world nominal GDP was 6.19%. The real GDP growth rate was 1.37%.
The raw data came form the IMF “World Economic Outlook” and the CAGR came from using the XIRR function in Excel.
Now let’s look at the S&P 500 price level changes.
We used the XIRR function to calculate the S&P price CAGR (not total return) from various starting points with data beginning as early as 1926, through the high reached on October 11, 2007 and through the recent low reached on March 6, 2009.
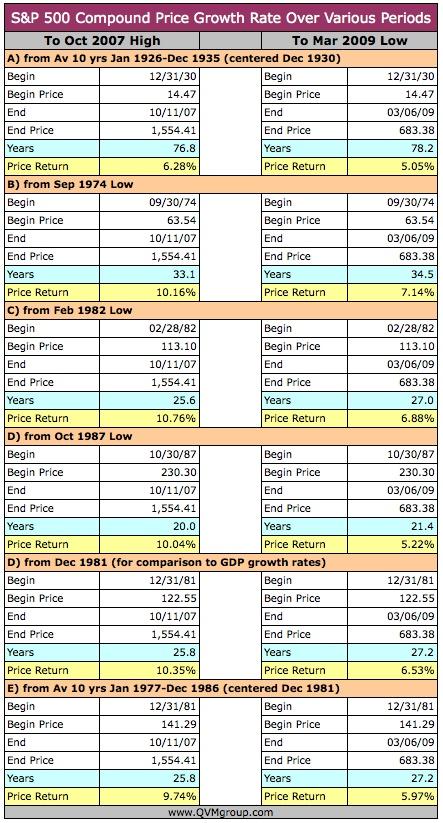
Effective rate of price return from December 1981 at various hypothetical current index price levels:
(as of April 24, 2009)
- 600 — 5.99%
- 650 — 6.30%
- 700 — 6.59%
- 750 — 6.86%
- 800 — 7.11%
- 850 — 7.35%
- 900 — 7.58%
- 950 — 7.79%
- 1000 — 7.99%
- 1050 — 8.19%
Effective rate of price return from 10-year average centered at December 1981 to various hypothetical current index price levels:
(as of April 24, 2009)
- 600 — 5.43%
- 650 — 5.74%
- 700 — 6.03%
- 750 — 6.30%
- 800 — 6.55%
- 850 — 6.79%
- 900 — 7.01%
- 950 — 7.22%
- 1000 — 7.42%
- 1050 — 7.61%
Interpretation of the Facts:
It is unlikely, in our view, that the vast bulk of the value of the US stock market (e.g. S&P 500 index) can persistently grow for long periods (e.g 27 + years since 1981) at a rate that is greater than the rate of the entire US and world economies (e.g. their nominal GDPs).
Since the US and world nominal GDPs from 1981 have been 5.78% and 6.19% respectively, those rates of growth would seem to be reasonable limits, or at least central tendencies, for the growth rate of the S&P 500 index price level.
In fact, we think, it is overreaching to assume that the S&P 500 price level could reach those growth rates, because the price level does not consider dividends that contribute roughly 1/3 of total return over long periods, according to our research and the research of others.
So, giving the index the benefit of the doubt (that it’s price could match US and world GDP while also generating substantial dividends), the current reasonable price level for the S&P 500 index may well be between 650 and 800.

Prior Probing for Likely S&P 500 Index Level:
In prior articles, we have used long-term charts (some over 80 years), historical valuation multiples, historical earnings, current earnings, projected earnings, normalized earnings, operating earnings and “as reported” earnings; as well as price-to-book, price-to-sales, and index-market-cap-to-national-GDP to try to get a handle on where the price of the S&P 500 makes the most sense.
- Markets Are a Mixed Bag (April 18, 2009): plausible index value 400 to 925, based on various valuation methods reported in the March 9 Barron’s
- Multi-Year Fundamental Valuation (April 6, 2009): plausible index value 500 to 1000, based on multi-year normalized earnings and historical normalized P/E ratio
- Fundamental S&P 500 Index Price Projections (April 4, 2009): plausible index value 500 to 1200, based on different analysts use of different assumptions and methods
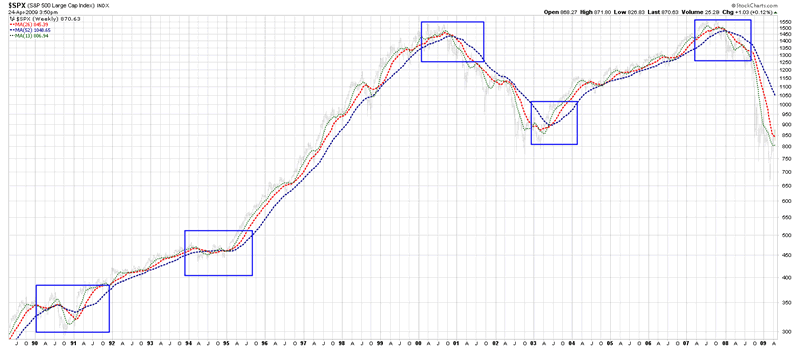
- S&P 500 Trends: 1980 - 2009 (March 13, 2009): plausible index value 735 to 980, based on 30-year chart trend analysis
- Price Targets for SPY (September 29, 2009): plausible index value 800 to 1050, likely 960, based on recent chart analysis of SPY, with likely 960 based on earnings at that time (SPY priced at 1/1oth of index price)
- Plausible S&P 500 Downside Target at 500 (January 20, 2009): plausible index bottom at about 500 using visual curve fitting compound growth rate curves on the shape of 81 year S&P 500 chart
Conclusion:
Nobody knows the future, and the market humbles all men. However, we all must peer into it anyway to choose our courses. While the markets are not rational in the short-term, they are probably rational over the long-term, so we try to be rational about what might happen.
All of the rational attempts we have made rolled up into a composite suggest that the S&P 500 is more likely, in a rational world, to be currently priced in range of 600 to 1000, with a tighter range probably 650/700 to 800/850.
Of course, being irrational in the short-term, the index could go higher or lower than that range. Also, the current worldwide economic situation is uniquely difficult and may continue to deteriorate, making short-term predictions perilous. In the long-term (perhaps 5 to 10 years), however, the current level of the market will likely be seen as roughly reasonable.
The apparently reasonable long-term index price notwithstanding, do note that the long-term macro view of index price behavior does not yet suggest a new upward trend is in place. Bottoms end below and tops end above what would be considered reasonable price levels.
If you have a long time horizon, investing broadly now is probably fine. If you have a short horizon or are currently relying on your portfolio for lifestyle support, much more cautious and selective position taking is necessary to control risk.
Winning by not losing is the byword for the retired or those who have completed the savings stage of their financial lives.
By Richard Shaw
http://www.qvmgroup.com
Richard Shaw leads the QVM team as President of QVM Group. Richard has extensive investment industry experience including serving on the board of directors of two large investment management companies, including Aberdeen Asset Management (listed London Stock Exchange) and as a charter investor and director of Lending Tree ( download short professional profile ). He provides portfolio design and management services to individual and corporate clients. He also edits the QVM investment blog. His writings are generally republished by SeekingAlpha and Reuters and are linked to sites such as Kiplinger and Yahoo Finance and other sites. He is a 1970 graduate of Dartmouth College.
Copyright 2006-2009 by QVM Group LLC All rights reserved.
Disclaimer: The above is a matter of opinion and is not intended as investment advice. Information and analysis above are derived from sources and utilizing methods believed reliable, but we cannot accept responsibility for any trading losses you may incur as a result of this analysis. Do your own due diligence.
Richard Shaw Archive |
© 2005-2022 http://www.MarketOracle.co.uk - The Market Oracle is a FREE Daily Financial Markets Analysis & Forecasting online publication.