ETFs with Rising and Falling Long-Term Moving Averages
Stock-Markets / Exchange Traded Funds Apr 23, 2009 - 08:42 AM GMTBy: Richard_Shaw
 There is tremendous concentration of day-to-day price movements recently and understandably so with all the carnage and fear. However, it may be helpful to zoom out a little bit to look at some longer periods.
Buying rising funds makes more sense than buying flat or declining funds, but you still need to consider how the fund objective fits into your concept of the overall markets and economy, how good the fundamentals of the underlying portfolio are, how attractive the valuation is, and what risks could upset the apple cart for the fund. At a minimum, though, it would be best if the fund were rising not falling when you buy it, and to continue to hold it.
Today we looked at the 183 largest ETFs by Dollar trading volume, and queried which were rising and falling based on the 52-week, 26-week, 13-week and 4-week simple moving averages.
We defined “rising” this way:
- 52-week SMA now > 52-week SMA 4 weeks ago
- 52-week SMA 4 weeks ago > 52-week SMA 13 weeks ago
- 52-week SMA 13 weeks ago > 52-week SMA 26 weeks ago
- 26-week SMA > 52-week SMA
- 13-week SMA > 26 week SMA
- 4-week SMA > 13-week SMA
We picked those criteria, not only because the may be of interest to the calmer and more patient investor than the active trader. They also make some sense to us, because they represent the behavior of a large group of investors who review their portfolios pretty much on a calendar basis: monthly (4-week SMA), quarterly (13-week SMA), semi-annually (26-week SMA) and annually (52-week SMA). All of the periods correspond in some way to those calendar approaches.
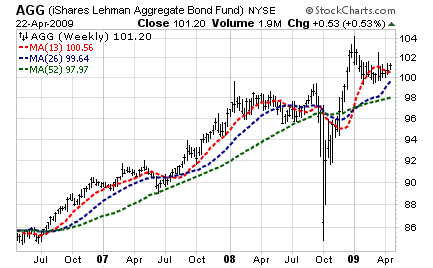
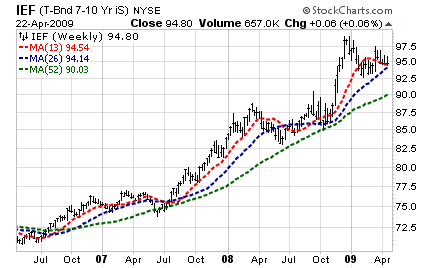
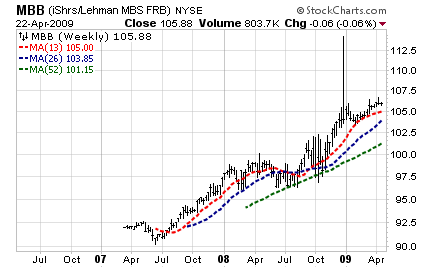
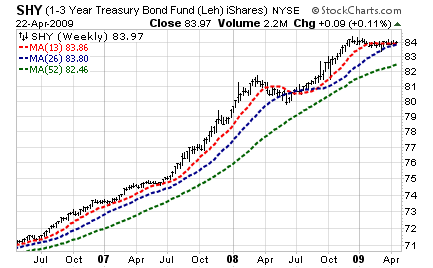
Here are the 8 larger (more liquid) ETFs that past the rising averages filter.
- AGG
- BND
- CSJ
- IEF
- IEI
- MBB
- SHV
- SHY
They are all in the fixed income category, and are predominantly US government funds, except for CSJ, AGG and BND. CSJ is a 1-3 year credit fund. AGG and BND are credit/government funds that represent the entire US bond market excluding municipals, maturities below one year and convertibles.
A few sample charts are:
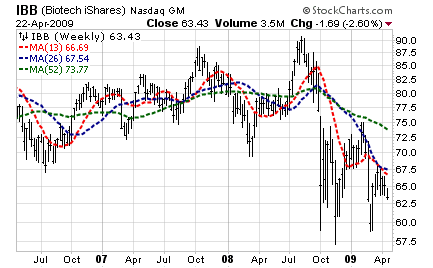
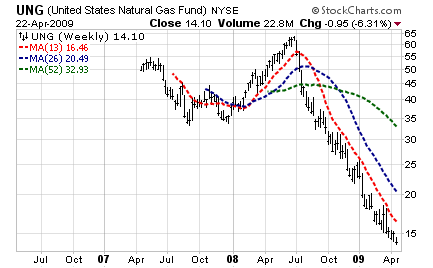
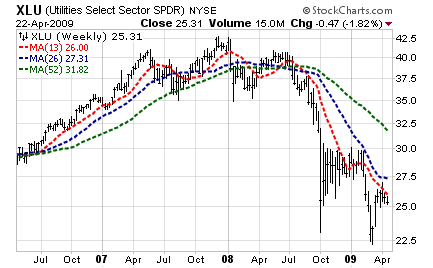
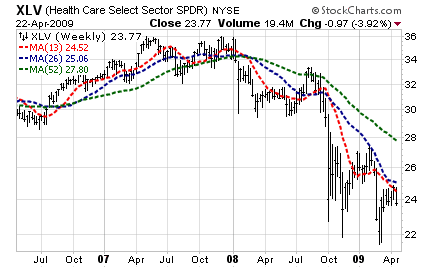
We defined “falling” as simply the opposite of rising, by reversing the operators from “>” to “<”:
- 52-week SMA now < 52-week SMA 4 weeks ago
- 52-week SMA 4 weeks ago < 52-week SMA 13 weeks ago
- 52-week SMA 13 weeks ago < 52-week SMA 26 weeks ago
- 26-week SMA < 52-week SMA
- 13-week SMA < 26 week SMA
- 4-week SMA < 13-week SMA
These 10 funds passed the filter (failed to be attractive):
- IBB
- IDU
- IYH
- PPH
- UNG
- VHT
- VPU
- XBI
- XLU
- XLV
The are all health care and utility oriented, even the UNG which is for natural gas, a key input to the utlity industry.
Some charts for the falling group are:
The other 165 of the 183 most liquid ETFs are somewhere between “rising” and “falling” according to this more macro than micro view of what’s going on in the markets.
By comparison, let’s look at the US market through the S&P 500 index (SPY) and the China market through the FTSE/Xinhua 25 (FXI). Their charts have ignited great enthusiasm and debate, but they rest in the range in between the rising and falling criteria used in this article.
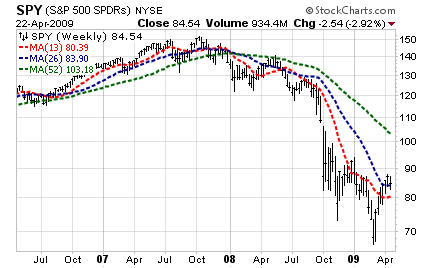
SPY escaped the falling category, because its 4-week (one month) SMA is greater than its 13-week (one quarter) SMA. SPY is in rally mode, but not yet ripe for those with longer evaluation cycles. One might say the SPY is on a minor upward trend, but not a major upward trend.
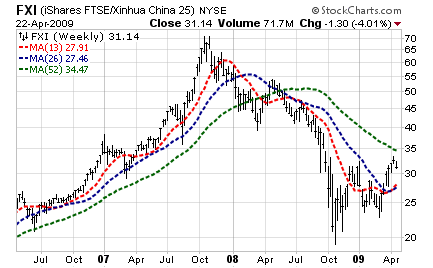
China is in a more significant but still minor upward trend, not yet a major upward trend, if you chose to use the time periods employed in this study.
For those for whom conservation is key and who are not prepared to enter and exit the markets in an agile way, major trends are a safer bet than minor trends.
Because moving averages are lagging indicators, their use always creates some “give up” waiting for the “all clear”. On the other hand, they are less prone to “head fakes” when the averages used are of significant length.
As we showed in a prior article, there are long multi-year cycles where plenty of money can be made (and plenty of losses can be avoided) by using longer averages as guides, AND by being willing to be out of the market when it is in a major down trend.
There is certainly money to be made in shorter cycles, as some are doing today with SPY and FXI and many other funds and stocks, but those participants need to stay on top of their investments more intensively and more frequently than most people are willing or able to do.
Different approaches and investment risk levels suit different people. This is just one. Knowing who you are and what suits you best financially, emotionally, and in terms of your level of intellectual engagement and time commitment in the process, are critical elements of investment success.
By Richard Shaw
http://www.qvmgroup.com
Richard Shaw leads the QVM team as President of QVM Group. Richard has extensive investment industry experience including serving on the board of directors of two large investment management companies, including Aberdeen Asset Management (listed London Stock Exchange) and as a charter investor and director of Lending Tree ( download short professional profile ). He provides portfolio design and management services to individual and corporate clients. He also edits the QVM investment blog. His writings are generally republished by SeekingAlpha and Reuters and are linked to sites such as Kiplinger and Yahoo Finance and other sites. He is a 1970 graduate of Dartmouth College.
Copyright 2006-2009 by QVM Group LLC All rights reserved.
Disclaimer: The above is a matter of opinion and is not intended as investment advice. Information and analysis above are derived from sources and utilizing methods believed reliable, but we cannot accept responsibility for any trading losses you may incur as a result of this analysis. Do your own due diligence.
Richard Shaw Archive |
© 2005-2022 http://www.MarketOracle.co.uk - The Market Oracle is a FREE Daily Financial Markets Analysis & Forecasting online publication.


