Looking for Signs of Economic Recovery From the Deepest Recession Since the Great Depression
Economics / Recession 2008 - 2010 Apr 21, 2009 - 01:03 PM GMTBy: Paul_L_Kasriel
 Is the economic recovery at hand? No, we still are mired in a recession that is going to be of the longest duration in the post-WWII era (the previous record was 16 months) and is likely to involve the largest annual average contraction in real GDP for a single year (the record to beat is a decline of 1.9%, which occurred in 1982). But there is a good chance that the worst for the U.S. economy in terms of quarterly contractions in real GDP is behind us, occurring in the fourth quarter of 2008. We currently are forecasting an annualized rate of contraction in real GDP of 3.8% in the first quarter of this year vs. the annualized rate of contraction of 6.3% in the fourth quarter of 2008. So, economic activity still is descending, but our forecast has the rate of descent moderating. We do not expect any growth in real GDP until the fourth quarter of this year.
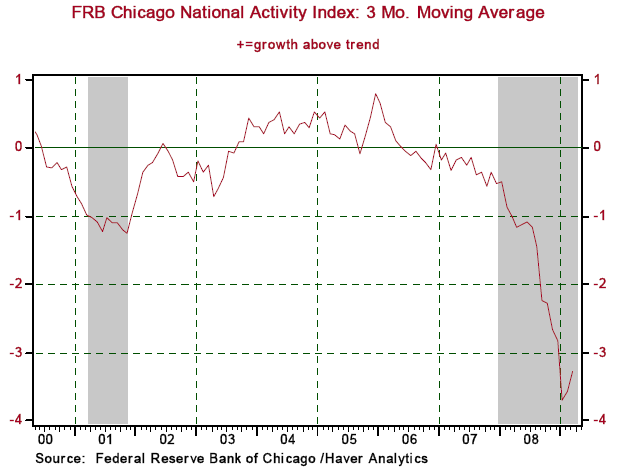
Evidence of a moderation in the rate of descent of economic activity can be found in the Federal Reserve Bank of Chicago's National Activity Index (NAI). The NAI is a weighted average of 85 existing monthly indicators of economic activity drawn from five broad categories: 1) output and income 2) employment, unemployment and hours 3) personal consumption, housing starts and sales 4) manufacturing and trade sales and 5) inventories and orders. This index is constructed to have an average value of zero and a standard deviation of one. Since economic activity tends toward trend growth rate over time, a positive index corresponds to growth above trend and a negative index corresponds to growth below trend. The Chicago Fed suggests that the best way to use the NAI as a gauge of coincident economic activity is on a 3-month moving average basis. Chart 1 shows that the NAI on a 3-month moving average basis put in at least a temporary trough in January of this year.
Chart 1
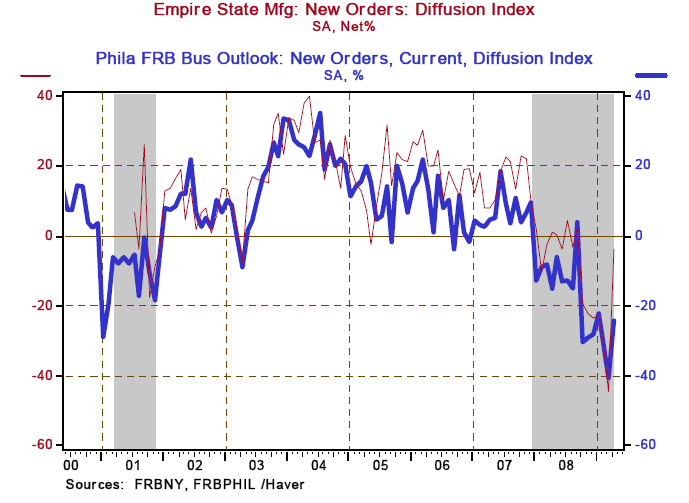
Similarly, the 3-month moving average of the Institute for Supply Management (ISM) Composite Index, which is a weighted average of the ISM Manufacturing and Nonmanufacturing Composite Indexes, may have put in a trough in February of this year (see Chart 2). Perhaps as a preview to the April ISM Manufacturing survey, the new orders index in the manufacturing surveys of both the Philadelphia Fed and the Buffalo branch of the New York Fed rebounded significantly in April, albeit still indicating a contraction in new orders (see Chart 3).
Chart 2
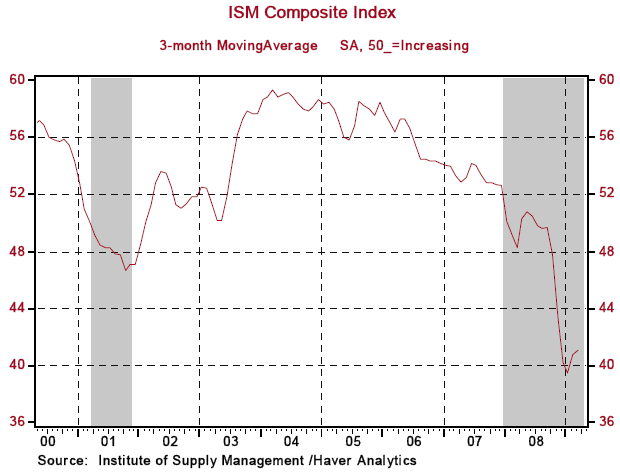
Chart 3
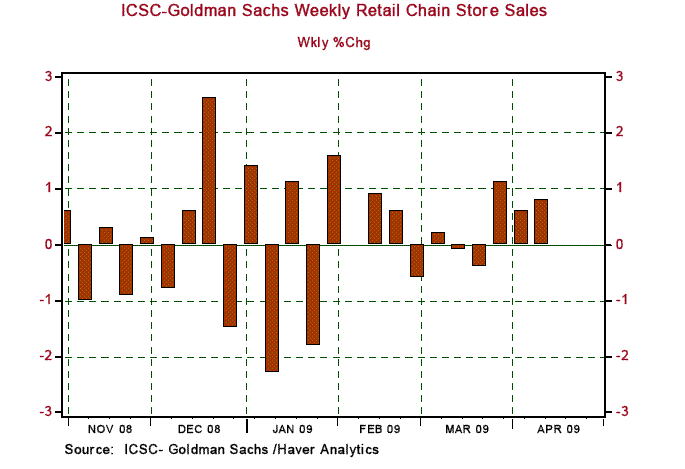
It is likely that real consumer spending grew in the first quarter of this year after having contracted in the third and fourth quarters of last year. At least, this is what the behavior of "real" retail sales is suggesting. When nominal retail sales data are deflated by the CPI for goods, the quarterly average of this proxy for real retail sales grew at an annual rate of 2.5% in the first quarter of this year after having contracted in each of the five preceding quarters (see Chart 4). Although both nominal and "real" retail sales fell in March, there has been a rebound in same-store nominal chain-store sales in the three weeks ended April 11 (see Chart 5). The weak showing for retail sales in March and the apparent rebound in late-March - early-April might be related to the relatively late Easter holiday this year.
Chart 4
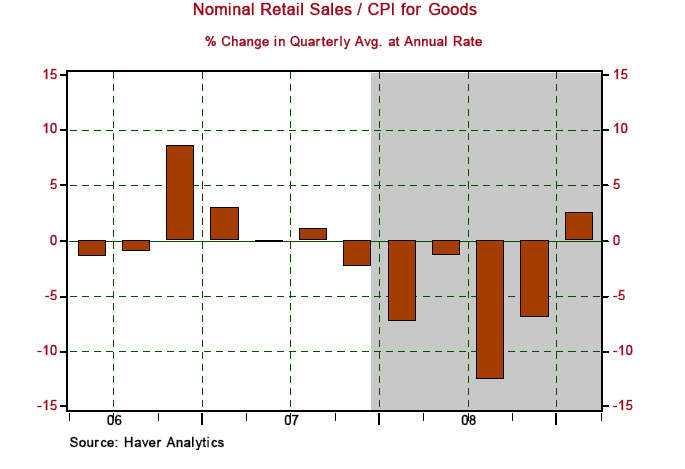
Chart 5
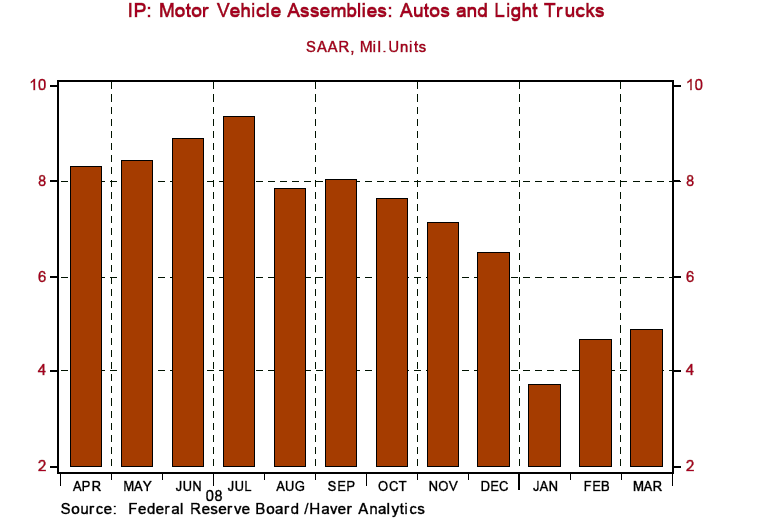
In March, car and truck sales increased 8.15% month-to-month on a unit basis. Although these unit sales contracted at an annual rate of 28.1% in the first quarter of this year, this is a marked slowing in the rate of descent compared with the 59.1% contraction in the fourth quarter of last year. With car and truck production sharply curtailed in January and with the modest increase in March sales, it stands to reason that production also might be increasing. Although well below year-ago levels, Chart 6 shows that production of cars and trucks did increase in both February and March. We do not mean to suggest that the consumer recession is over, but we do believe that the worst of it is over.
Chart 6
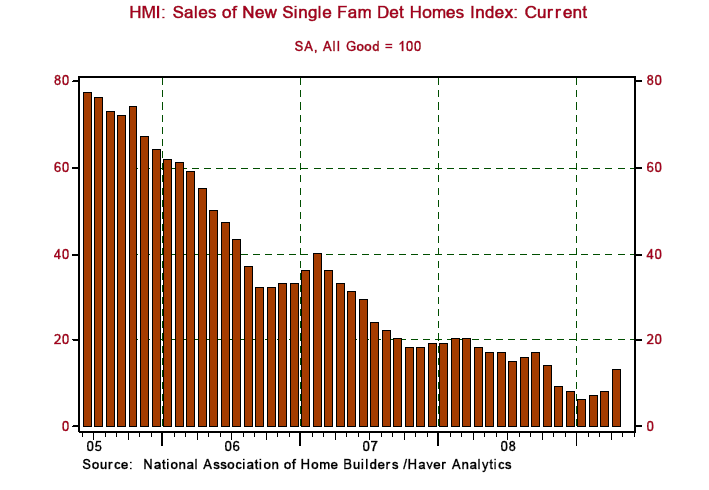
The housing recession also is not over, but this recession, too, may have seen its worst, at least in terms of sales. In February, the purchase of existing homes was the most affordable in almost 40 years according to an index calculated by the National Association of Realtors (see Chart 7). In 2005, the ratio of the median price of an existing home to median family income was at its highest level since 1968. In early 2009, this ratio was at its lowest level since 1968. The 30-year conventional mortgage rate is the lowest since 1971. This year, first-time homebuyers can receive a federal income tax credit up to $8,000. Not surprisingly, with the homes being the most affordable to purchase in almost 40 years, home sales have increased. Existing home sales increased in both December of last year and February of this year. New home sales increased in February of this year. Moreover, although well off its cycle high, a diffusion index of new home sales from a survey conducted by the National Association of Home Builders has increased in each of the three months ended April, with the April index showing a significant rise (see Chart 8).
Chart 7
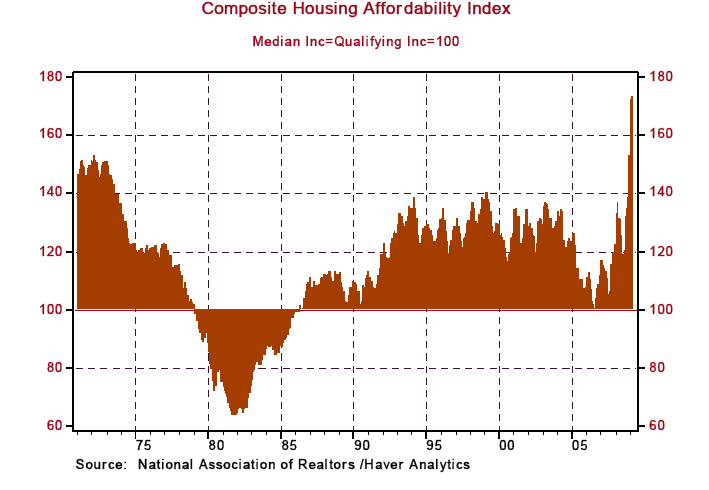
Chart 8
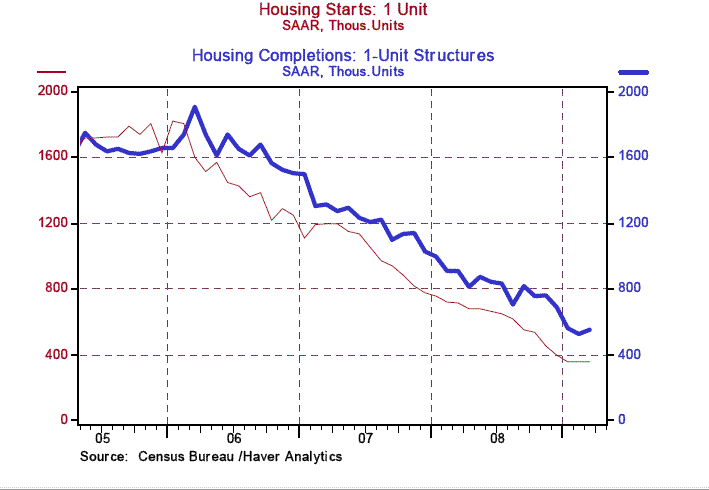
Mind you, there is a huge inventory of unsold houses that we know of and probably a huge inventory of unsold houses that we do not know about from homeowners who want to sell but have been reluctant to put their houses on the market with demand up until now having been moribund. So sharp increase in the production of new homes is not what is called for at this time. But the bottoming out of production obviously would be a plus for GDP. And, as shown in Chart 9, both the starts and completions of single-family homes appear to be forming a bottom.
Chart 9
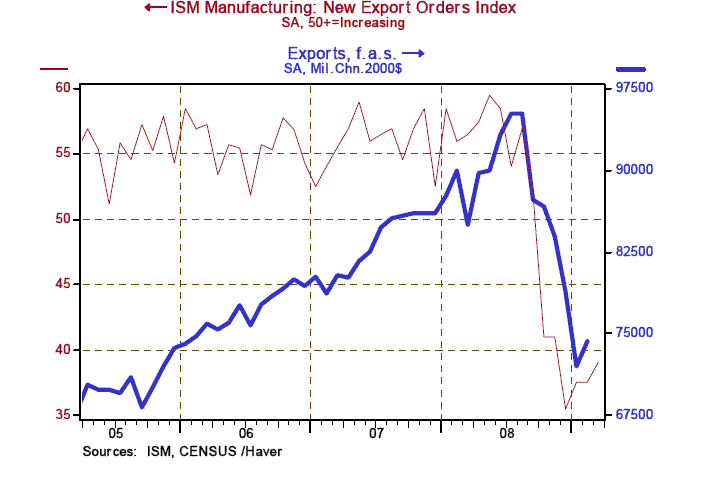
Just as the U.S. economy remains mired in a recession, most of the rest of the world does too. Nevertheless, it is noteworthy that U.S. goods exports rebounded in February and the ISM manufacturing new export orders index appears to have bottomed in December of last year (see Chart 10).
Chart 10
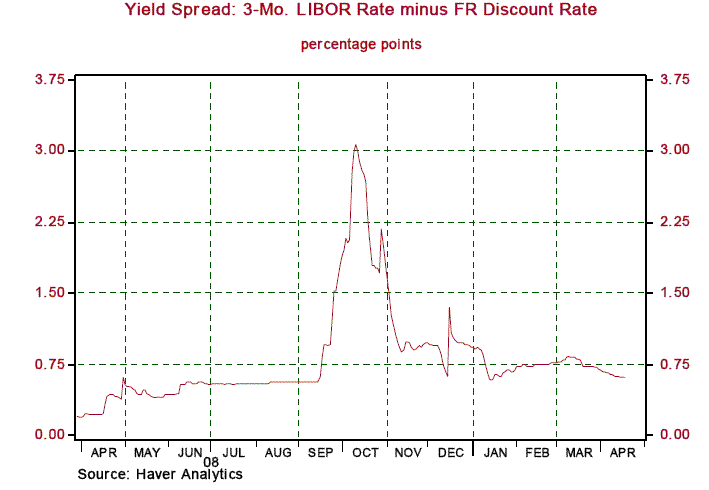
Risk aversion is moderating. For example, the yields on non-investment grade corporate bonds as well as investment grade financial-sector corporate bonds are declining (see Chart 11). Likewise, yields on securities backed by credit card and auto loan receivables are falling (see Chart 12). Banks seeking 3-month funding can obtain it either in the 3-month LIBOR market or at the Fed's discount window. So, the behavior of the yield spread between the 3-month LIBOR rate and the Fed's discount rate is a gauge of risk aversion in the interbank loan market. The wider the spread, the more risk aversion. Chart 13 shows that this spread has narrowed considerably since the Lehman bankruptcy in September of last year. Risk aversion in the credit markets remains abnormally high. Nevertheless, its degree of abnormality is slowly abating.
Chart 11
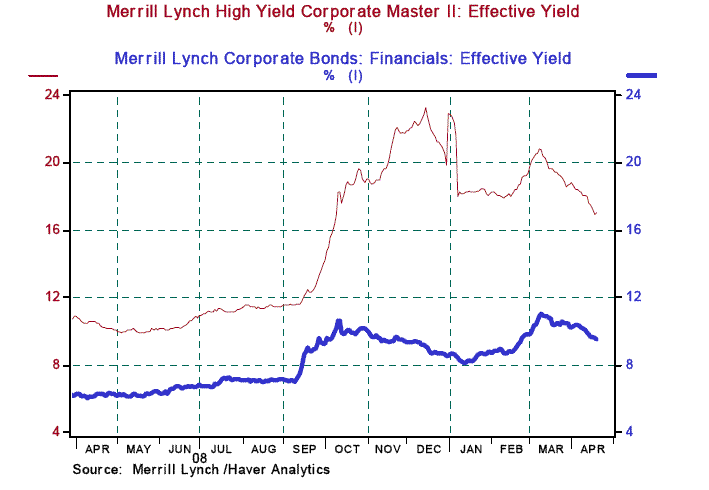
Chart 12
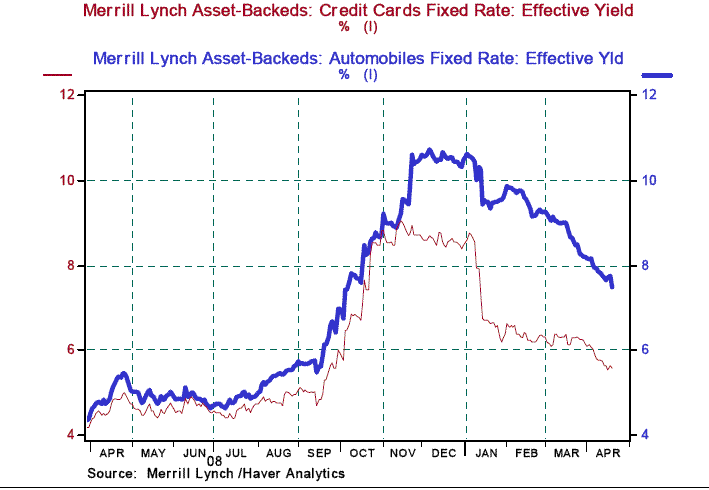
Chart 13
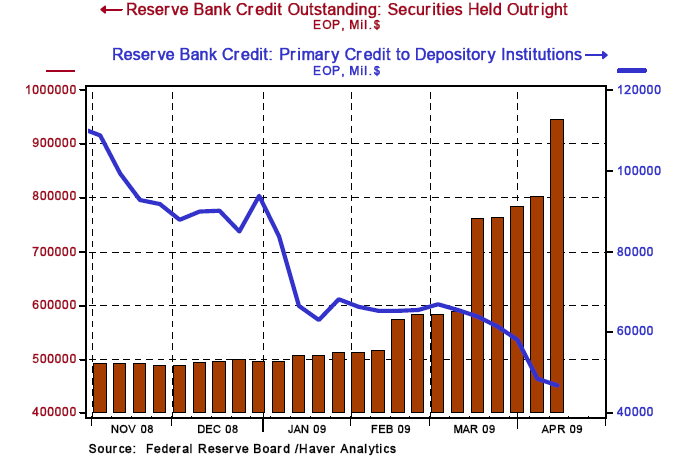
While the capital-impaired commercial banking system continues to contract the amount of credit it is creating, the capital-unimpaired Federal Reserve System is creating credit (see Chart 14). What is especially significant about the recent increase in Federal Reserve credit is that it is not increasing in the form of discount window loans to banks but mostly in the form of open market securities purchases, primarily mortgage-backed securities and longer-maturity Treasury bonds (see Chart 15). To a disappointingly smaller degree, only about $6.4 billion dollars, the increase in Federal Reserve credit also is coming from the Term Asset-Backed Securities Loan Facility (TALF) program. The Fed's open market purchases of securities and the credit created via TALF, in effect, represent the Fed's efforts to provide credit to the nonfinancial sector at a time when the private financial sector is incapable of doing so. These Fed efforts, especially if the TALF program begins to grow faster, will play a crucial role in bringing on the economic recovery.
Chart 14
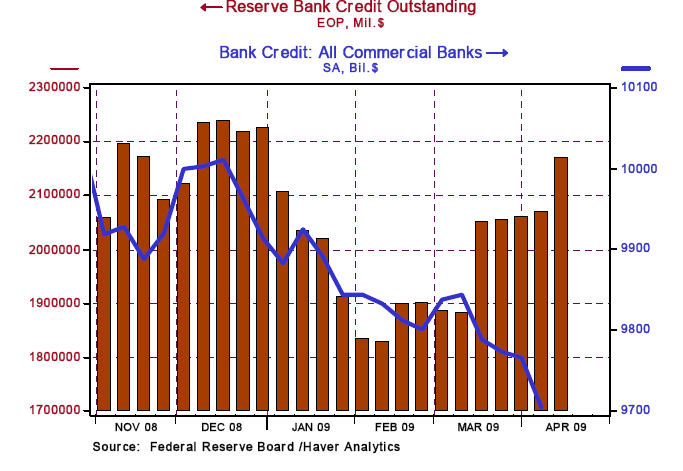
Chart 15
Typically, when the private financial sector becomes capital impaired, as occurred in the U.S. in the early 1930s, early 1990s and today, the public's demand for liquidity increases. But it typically also is at these times when the private financial system is unable to provide the liquidity desired by the public. That is, the money supply either falls or its rate of growth slows significantly, especially in price-adjusted terms. Chart 16 shows how weak CPI-adjusted M2 money supply growth was in the early 1930s.
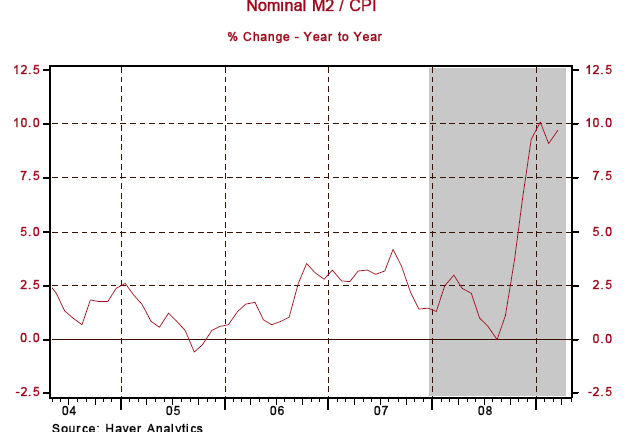
Chart 17 shows that the CPI-adjusted M2 money supply growth was also very weak in the early 1990s. In contrast to these prior periods of capital-constrained private financial systems, the CPI-adjusted M2 money supply is now growing at almost 10% year-over-year (see chart 18). This is largely due to the Federal Reserve's record credit creation. If it were not for this rapid growth in the real supply of money at a time when the public's demand for real liquidity was increasing significantly, the current economic downturn would be even worse than it is and there would be little reason to expect a recovery any time soon.
Chart 16
(1928-1933)
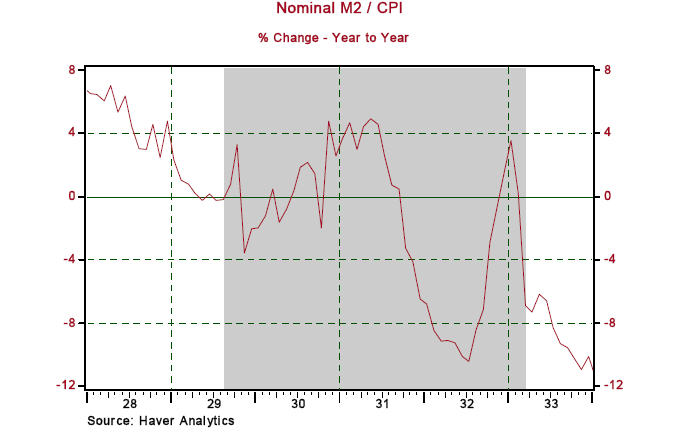
Chart 17
(1989-1993)
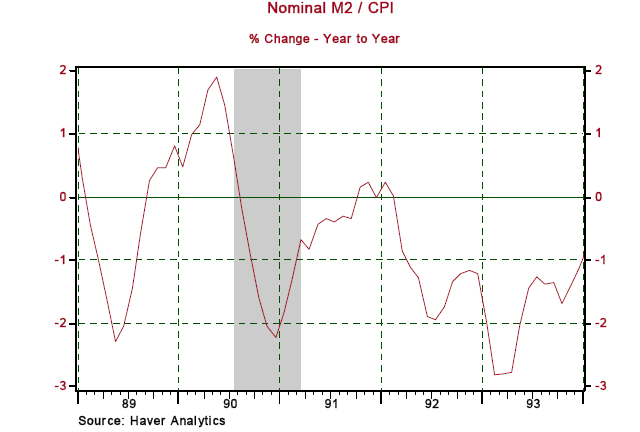
Chart 18
(2004-2009)
As we said at the outset of this commentary, this is the most severe recession the U.S. economy has endured in the post-WWII era. But bear in mind that there has never been a more vigorous monetary policy and fiscal policy response than what is now occurring. The unemployment rate is destined to move higher over the remainder of this year and probably over the first half of 2010. Credit problems will continue to plague the financial system. But with the federal government stepping in to provide demand for goods and services as the private nonfinancial sectors delever and with the Federal Reserve providing credit to the nonfinancial sector as the private financial sector recapitalizes, the economy stands a good chance of beginning a recovery by the fourth quarter of this year.
THE NORTHERN TRUST COMPANY ECONOMIC RESEARCH DEPARTMENT
April 2009 SELECTED BUSINESS INDICATORS
Table 1 US GDP, Inflation, and Unemployment Rate
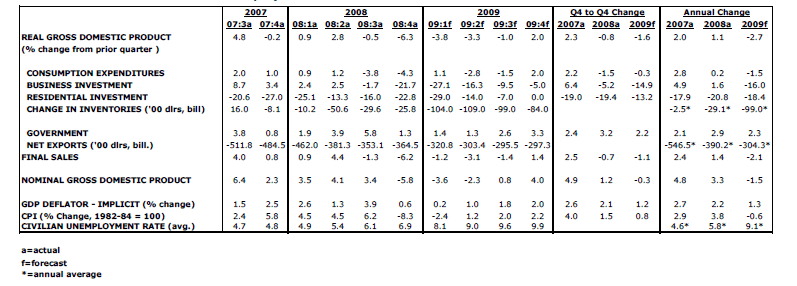
Table 2 Outlook for Interest Rates

Paul Kasriel is the recipient of the 2006 Lawrence R. Klein Award for Blue Chip Forecasting Accuracy
By Paul L. Kasriel & Asha Bangalore
The Northern Trust Company
Economic Research Department - Daily Global Commentary
Copyright © 2009 Paul Kasriel
Paul joined the economic research unit of The Northern Trust Company in 1986 as Vice President and Economist, being named Senior Vice President and Director of Economic Research in 2000. His economic and interest rate forecasts are used both internally and by clients. The accuracy of the Economic Research Department's forecasts has consistently been highly-ranked in the Blue Chip survey of about 50 forecasters over the years. To that point, Paul received the prestigious 2006 Lawrence R. Klein Award for having the most accurate economic forecast among the Blue Chip survey participants for the years 2002 through 2005.
The opinions expressed herein are those of the author and do not necessarily represent the views of The Northern Trust Company. The Northern Trust Company does not warrant the accuracy or completeness of information contained herein, such information is subject to change and is not intended to influence your investment decisions.
Paul L. Kasriel Archive |
© 2005-2022 http://www.MarketOracle.co.uk - The Market Oracle is a FREE Daily Financial Markets Analysis & Forecasting online publication.


