


Financial Markets Are a Mixed Bag- ETF Attributes: Part 1 - Vanguard
Stock-Markets / Stocks Bear Market Apr 19, 2009 - 06:01 PM GMTBy: Richard_Shaw

 Nietzsche said “Out of chaos comes order”. Obama says there are signs of green shoots and glimmers of hope. George Soros and Nouriel Roubini say if you thought 2008 was bad, you ain’t seen nothin’ yet.
Quite a range of possibilities! How to deal with them?
Getting out of the way of the 2008 train wreck when we did before it happened was a good thing. Now the issue is what to do with the cash
Financial Life Stage Issues:
In retrospect, we would like to have participated in the current stock rally, but prudence trumped opportunity in the portfolios for most of our clients, because they are “mature” portfolios, meaning the owners cannot replace losses with new income; and most currently or soon will rely on their portfolios for current income to support their lifestyle.
This writer is in that broad “mature” portfolio category. While actively working and not drawing on the portfolio for lifestyle, it is unlikely that major losses could be replaced out of future earned income.
Stage of financial life is an important attribute to get straight when making investment decisions.
Advice for a young person in the early stages of asset accumulation would be far more aggressive in times like these, than for a person of any age who has past the point in asset accumulation where new savings are no longer a significant addition to the total value of the portfolio. That is particularly so for those investors paying for their lifestyle with asset withdrawals.
The “mature” portfolio category also includes foundations and non-profit organizations that have been funded, but do not have the ability to recapitalize if they “blow” their portfolio.
What We Seek:
Given that we work as advisors in the area of “mature” portfolios, we are searching each day for good long-term equity income positions and expect a stock market pull-back for a better entry point. We are ahead of the game with US stocks since the beginning of 2008. We have aspirations to re-enter the US stock market below S&P 500 at 750. Time will tell.
Our guiding principle is a fusion between so called fundamental and technical approaches. We seek:
- an appealing story
- solid financials
- attractive valuation
- a rising price pattern
- an absence of major obvious risk factors.
The current stock market environment presents a bounty of opportunities for points numbered 1-3 and a large number of securities with currently rising prices (number 4). Number 5 (absence of major obvious risks) has been an impediment.
Remember, that this writer and our clients are at the end of, or have past, our asset accumulation years, and are now in the conservation, nurturing and harvesting stage. We have to win in part by not losing.
How Is It Working?
Let’s look at this writer’s portfolio, which is managed in a cautious manner based on the five principles listed above.
While we are not a traders and do look to the long-term, we do not subscribe to the idea that an investor has to spit into the wind or to stand in the middle of the tracks when a freight train in bearing down upon him.
In the case of 2008, we exited risk positions entirely, going to 100% cash, sometime in July before the Q4 disaster. Since late 2008, we have been slowly rebuilding positions — bonds first, energy income positions second, pipeline income third (probably should have done pipelines second and energy income third), and income oriented stocks last. That has been the general thread of the rebuilding process we have taken for the “mature” portfolios we manage. In most cases, except energy income and pipelines, we use investment funds, although until the overall tide turns, stock picking will probably outperform diversified funds.
For my own portfolio (a “mature” portfolio), I entered 2008 with 100%, ended 2008 with 92.2% and as of April 17 have a value of 103.8% of the 12/31/2007 starting point. That is hardly an exciting return, but neither is it a devastating return.
My personal performance benchmark is 70% S&P 500 and 30% US Aggregate bonds. The benchmark entered 2008 with 100%, ended 2008 with 76.8% and as of April 17 is valued at 74.2% of 12/31/2007.
To be fair, it must be noted that the benchmark performance does not include dividends and interest, while the personal portfolio data does include them. Income is relatively more important in down markets than in up markets. Incomes provide the investor with more staying power.
So, by getting out of the way of big losses that probably could not be replaced, I live to play on. However, that conservatism kept me from piling on during the current rally.
Would I like to have gone all-in on March 9th and be up a ton by today? — you bet! Did I have the capacity to deal with the consequences if the market kept going down? — yes to a limited degree because of stop loss orders, but even that much risk seemed too much six weeks ago. Like stopping an ocean liner, trend reversal takes time both in the mind and in market prices. Waiting for more proof of opportunity seemed the prudent thing to do.
The Picture Since 12/31/2007:
Recapping the challenge for all of 2008 through today, here is the price action by SPY (US stocks) and AGG (US bonds) that in some combination drive most benchmarks:
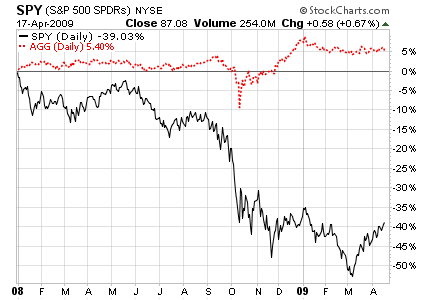
In very rough approximation, the S&P 500 today after all the excitement about this 6-week rally has risen to about where is was in October 2008, when many investors thought the financial world was coming to an end.
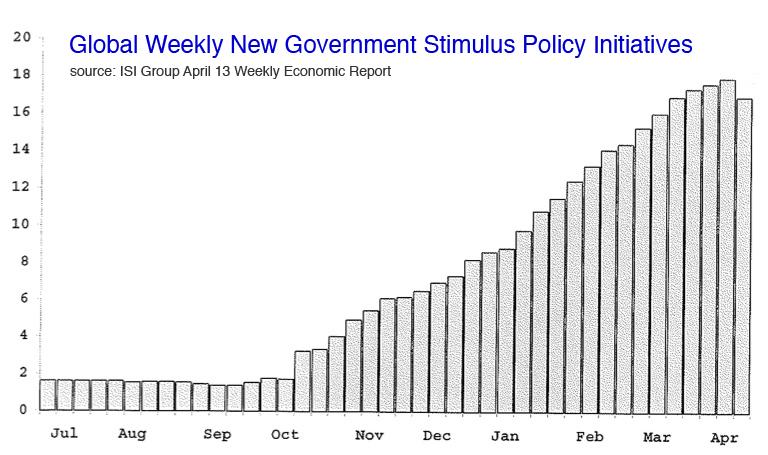
The number and pace of economic stimulus policy initiatives being announced around the world is creating so much “noise” and uncertainty in the usual economic and financial markets, that judgments about the future are suspect, whether bearish or bullish. Over 570 initiative have been announced globally in the past 20 months.
Markets work best when investors know the rules of the game, believe the rules will remain in-force and know generally who are the opposing players. We don’t know the rules anymore. We can’t believe the rules will remain in-force amidst the flurry of government interventions, and we don’t know how much and for how long the government will be the big player in the equity markets.
One thing sure, the unprecedented creation of money supply around the world will eventually reflate asset prices. Bonds have already benefited greatly. Stocks will follow at some point, but the ultimate impact will most probably be powerful inflation.
Bonds have been good to investors in the past few years with declining interest rates, but from here there is nowhere for rates to go but up, particularly when inflation recurs. That will not be good for bonds when it happens.
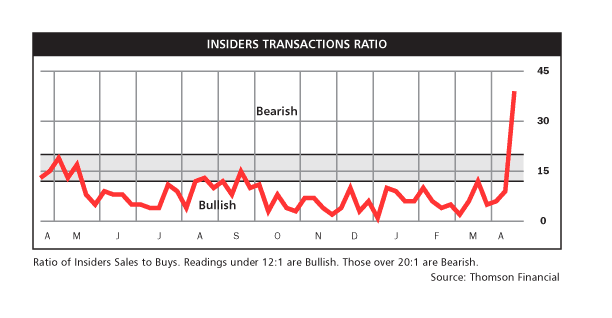
Insiders are certainly not giving stock investors encouraging signs. They appear to be bailing out personally on this government bail out driven stock rally.
Wishing Versus Believing:
Wishful thinking is dangerous. We wish there would be no more wars, but we don’t believe it. We wish the body politic was wise and concerned more about us than their own re-election, but we don’t believe it. We wish Obama could deliver on his promise to cut the deficit, but we don’t believe it. We wish the bear has gone into his cave to hibernate, but we don’t believe it. We could definitely be wrong, but the news that has fired up this rally seems more wishful than solid.
Improved bank earnings have yet to be shown lasting. Probable auto company bankruptcies have yet to play out. Tax increases at all levels have yet to impact consumer pocket books. China’s stockpiling of materials has yet to convert to increased exports. Obama’s stimulus programs have yet to stop multiplying. The US Treasury has yet to attempt to borrow the Trillions it needs to fund stimulus commitments.
Positive Market Signs Are Visible Too:
Yes the stock market anticipates, and it is doing so now both in price and reduced volatility. We just believe it is premature. Reduced volatility, however, is a positive sign.

S&P 500 internals have improved tremendously, but may also be a case of too much, too fast.
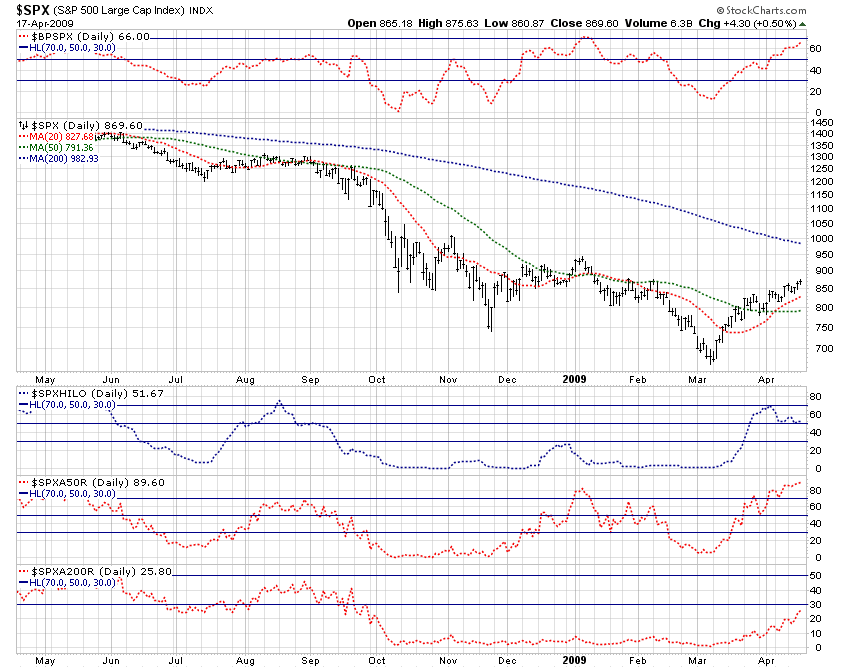
The percent of constituents with bullish point & figure charts is high. The ratio of new highs to the total of new highs and new lows has gone from the cellar to the roof, but has pulled back to near 50% in the last several days. The percent of constituents over their 50-day moving average is nearly 90%, and the percent over their 200-day average is up form nearly none to over 25%. Those are very positive signs.
Economic signs, however, are not as rosy as the stock market signs. Fed Chairman Bernanke, in a speech this past week, said: “We have seen tentative signs the sharp decline in economic activity might be slowing.”
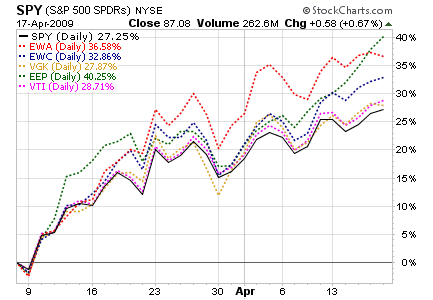
Best Markets in This Rally:
As stock markets go, the S&P 500 is not the most switched on. The balance of the developed world has done better than the S&P 500, as have the emerging markets. Within the US, technology, materials, and financial sectors have also been star performers.
Current Portfolio Construction:
The current rally has certainly been tempting, and in retrospect we can see how we might have jumped in with stops and made some serious money. Unfortunately, our risk aversion trumped our sense of opportunity. On the other hand, we are steadily rebuilding positions toward the ultimate global economic recovery.
Are we jealous of those who jumped in with both feet and made a load of money? — Yes. Are we being consistent with our risk management principles by taking measured steps? — Yes. Are we going to continue to increase stock exposure? — Yes, but with an equity income orientation so that we can capture a larger share of ultimate return in cash than we would without the income orientation. Will we hit home runs — not likely, just base hits. Will we lose our shirts? — No.
Note that about 1/3 of long-term historical stock returns come from dividends, and about 2/3 from gains. However, from current lower price levels, it may be possible to get upwards of 1/2 of long-term returns from dividends with the right picks, with the trade-off being missing possible home runs that pure growth investing might offer.
Continuing with the personal disclosure, here is my personal portfolio exposure composition — not a courageous one, but in popular ecological vernacular, probably a sustainable one with substantial remaining dry powder:
- Cash 54% (earning nothing)
- Muni bonds 12%
- Taxable bonds 16%
- Energy royalty trusts 6%
- Pipeline partnerships 5%
- Emerging markets stocks 4%
- US stocks 3%
Portfolio income based on trailing dividends is just under 3% of the current market value.
All listed positions have persistent trailing stop loss orders, and the few mutual funds have mental stops.
Not exciting to be sure, and definitely not a significant participant in the current rally, but with well less than 1/2 of the downside risk in what we believe is at least one more significant stock market direction reversal before a more sustainable rally that could become a major trend.
Pre-Rally Valuation Warnings:
As we admire the strong and swift rally of the last six weeks, let’s take a minute and look at some of the valuation warnings that were published in Barron’s for Monday March 9th. They did say a rally seemed likely and were quite correct. They also published a number of valuation statistics that suggested we had not reached an ultimate bottom for such a strongly negative economic environment. Remember, these warnings were rendered when the S&P was below 7oo, not near 900 as it is today.
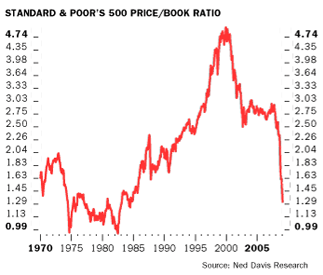
Felix Zulauf pointed out that the S&P historically made major bottoms at about 0.9 times book, yet then the S&P was at about 1.3 times book (implied bottom for S&P about 480 based on year-end S&P 500 book value of 529).
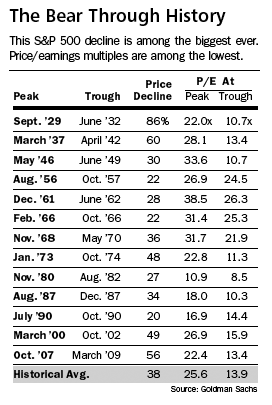
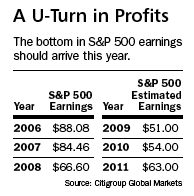
Goldman Sachs pointed out that the S&P bottomed at about 10 times forward operating earnings in 1974, 1982, and 1987. At the time of the article, forward operating earnings projections ranged from about $40 to $65 (implied bottom for S&P 400 to 650).
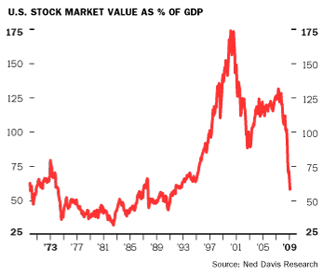
Goldman Sachs pointed out that the total market-cap of the S&P 500 as a multiple of the US Gross Domestic Product had not yet reached the lows of prior bottoms.
The managers of IVA funds pointed out that through the early 1980’s the S&P traded at about 7 times the 10-year average ["as reported"] earnings of the index, but that in the high 600’s it was at about 12 times the 10-year average (implied S&P down 42% to the vicinity of 400). They noted that the long-term average multiple is about 15-16 times (implying a possible S&P rise to about 850 to 925 to be in a “normal” situation). Our economy is certainly not “normal”, so we don’t get a good feeling with a market valued as if business was perking along without special problems.
We congratulate those who went all-in to stocks in early March and made a big score, presuming that were prepared to deal with the consequences had they been wrong. We aren’t ready to risk it all yet, but continue watchful waiting more optimistically than a few months ago.
That’s where we are. Good luck to you and to us all as we go forward.
By Richard Shaw
http://www.qvmgroup.com
Richard Shaw leads the QVM team as President of QVM Group. Richard has extensive investment industry experience including serving on the board of directors of two large investment management companies, including Aberdeen Asset Management (listed London Stock Exchange) and as a charter investor and director of Lending Tree ( download short professional profile ). He provides portfolio design and management services to individual and corporate clients. He also edits the QVM investment blog. His writings are generally republished by SeekingAlpha and Reuters and are linked to sites such as Kiplinger and Yahoo Finance and other sites. He is a 1970 graduate of Dartmouth College.
Copyright 2006-2009 by QVM Group LLC All rights reserved.
Disclaimer: The above is a matter of opinion and is not intended as investment advice. Information and analysis above are derived from sources and utilizing methods believed reliable, but we cannot accept responsibility for any trading losses you may incur as a result of this analysis. Do your own due diligence.
Richard Shaw Archive |
© 2005-2022 http://www.MarketOracle.co.uk - The Market Oracle is a FREE Daily Financial Markets Analysis & Forecasting online publication.