US Economy- Housing Market Bottoming, Credit Crisis Easing?
Economics / Recession 2008 - 2010 Apr 19, 2009 - 11:44 AM GMT Asha Bangalore (Northern Trust): Retail sales - story of weak consumer spending
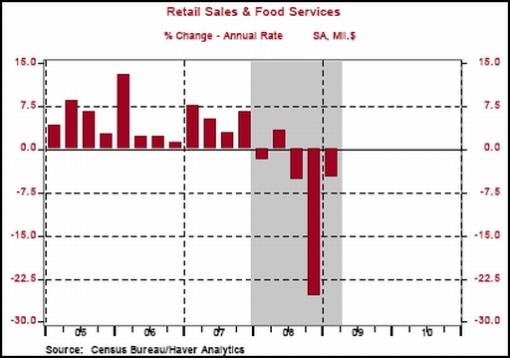
“Retail sales fell 1.1% in March following a 0.3% increase in February (previously estimated as a 0.1% decline). Retail sales of January were revised up slightly to a 1.9% gain from a 1.8% increase. In March, the 1.6% drop in gasoline sales accounted for some of the decline. In addition, auto sales were reported as a 0.9% drop despite the increase in unit sales to 9.8 million units from 9.2 million in February. Excluding autos and gasoline, retail sales fell 0.8% in March after a 0.7% jump in February.
“The widespread weakness of retail sales in March leaves the level of spending less than the quarterly average which is an arithmetical disadvantage for second quarter retail sales. Retail sales fell at an annual rate of 4.9% in the first quarter after a 25.5% plunge in the fourth quarter. Excluding gasoline, prices of which led to sharp drop in retail sales in the fourth quarter, retail sales edged down 0.4% in the first quarter compared with a 10.6% drop in the fourth quarter.”
Source: Asha Bangalore, Northern Trust - Daily Global Commentary, April 14, 2009.
Asha Bangalore (Northern Trust): Jobless Claims - mixed news
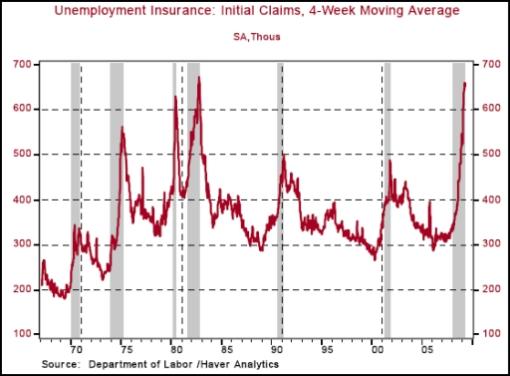
“Initial jobless claims fell 53,000 to 610,000 during the week ended April 11. The four-week moving average stands at 651,000, down from the cycle peak of 659,500. Historically, the four-week moving average peaks at the end of recession (see chart). If the four-week moving average were to post larger declines in the weeks ahead, it would be a meaningful signal that labor market conditions are turning the corner. It is premature to declare that a peak for four-week initial claims has been established.
“Continuing claims, which lag initial claims by one week, moved up 172,000 to 6.022 million, the first reading in excess of 6 million, and the insured unemployment rate rose to 4.5% from 4.4% in the prior week. These mixed signals should be sorted out in the weeks ahead.”
Source: Asha Bangalore, Northern Trust - Daily Global Commentary, April 16, 2009.
Asha Bangalore (Northern Trust): New home construction appears to be bottoming
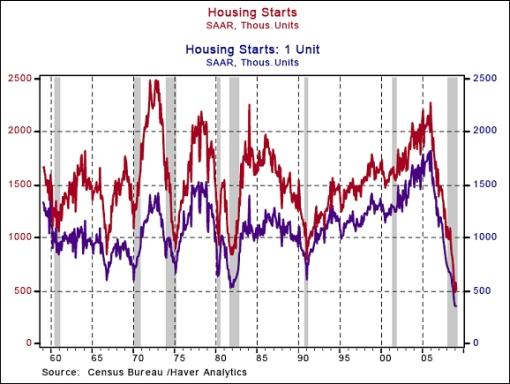
“Home construction appears to have established a bottom in January. Total housing starts fell 10.8% to an annual rate of 510,000 in March, the second-lowest on record. The record low is the 488,000 mark of housing starts in January 2009. It appears that housing starts readings of January 2009 could be the cycle low.
“The elevated level of inventories of unsold new homes is the main reason to be less optimistic about the March data of housing starts. There was a 12.2-month supply of unsold new homes in the marketplace as of February 2009; the record high of a 12.9-month supply of inventories was recorded in January 2009.”
Source: Asha Bangalore, Northern Trust - Daily Global Commentary, April 16, 2009.
Asha Bangalore (Northern Trust): Home Builders Survey shows optimism
“The Housing Market Index (HMI) of the National Association of Home Builders increased to 14 in April from 9 in March, which is the first encouraging sign about the housing market in addition to the increase in sales of homes in February.”
Source: Asha Bangalore, Northern Trust - Daily Global Commentary, April 15, 2009.
Asha Bangalore (Northern Trust): Factory sector remains significantly weak
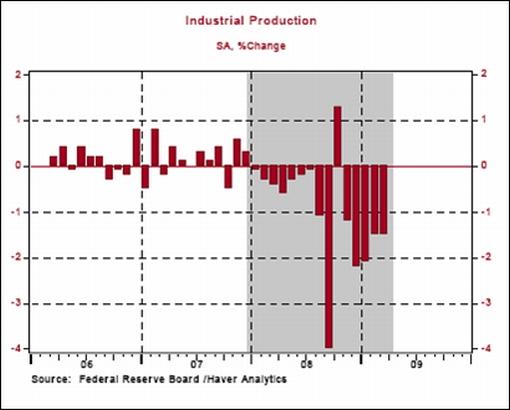
“Industrial production fell 1.5% in March, matching the decline recorded in the prior month. In the first quarter, industrial production has dropped at an annual rate of 20%. Total capacity utilization was 69.3% in March, a historical low for the series which dates back to 1967.”
Source: Asha Bangalore, Northern Trust - Daily Global Commentary, April 15, 2009.
Asha Bangalore (Northern Trust): Wholesale prices report - benign story for March
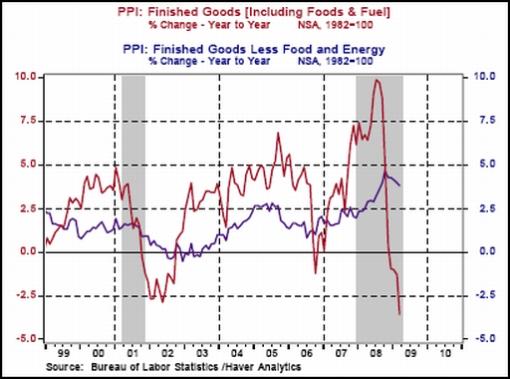
“The Producer Price Index (PPI) of Finished Goods fell 1.2% in March, inclusive of declines in prices of energy (-5.5%) and food (-0.7%). Energy prices fell at an annual rate of 2.7% in the first quarter after a 76.7% plunge in the prior quarter. Excluding food and energy, the core PPI of Finished Goods held steady in March. By contrast, food prices have fallen more sharply in the three months ended March (-10.1%) versus the three months ended December 2008 (-4.8%).”
Source: Asha Bangalore, Northern Trust - Daily Global Commentary, April 14, 2009.
Asha Bangalore (Northern Trust): Lower energy and food prices help to contain inflation
“The Consumer Price Index (CPI) fell 0.1% in March, following a 0.4% increase in February. The 0.38% year-to-year decline of the overall CPI is the first deflationary reading since 1955. Additional year-to-year declines are conceivable for the months ahead. The 3.0% drop in the energy price index and 0.1% decline of the food price index helped to bring down the overall CPI.
“Excluding food and energy, the core CPI moved up 0.2%, matching the gains seen in each of the prior two months. On a year-to-year basis, the core CPI increased 1.8%, down from the cycle high of a 2.54% gain in August 2008.
“Inflation, a lagging economic indicator, is contained for now. Concerns about inflation are growing in light of the size of the Fed’s balance sheet, which has expanded rapidly to support the financial system and stem the decline of economic activity. Chairman Bernanke has noted that the Fed has the policy tools and will to unwind the aggressive easing that is in place before inflationary trends become entrenched in the economy.”
Source: Asha Bangalore, Northern Trust - Daily Global Commentary, April 15, 2009.
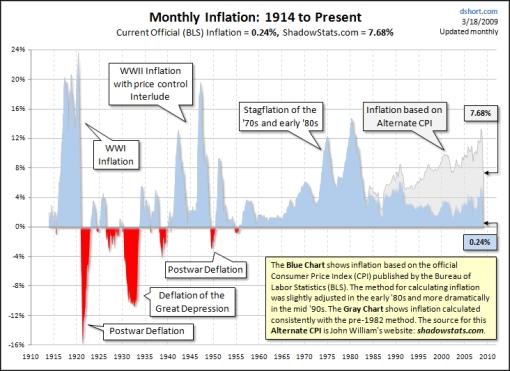
Dshort: Inflation - figures lie, and government liars figure
Source: Dshort, March 18, 2009.
The Wall Street Journal: Banks ramp up foreclosures
“Some of the nation’s largest mortgage companies are stepping up foreclosures on delinquent homeowners. That will likely lead to more Americans losing their homes just as the Obama administration’s housing-rescue plan gets into gear.
“JPMorgan Chase, Wells Fargo, Fannie Mae and Freddie Mac all say they have increased foreclosure activity in recent weeks. Those companies say they have lifted internal moratoriums which temporarily halted foreclosures.
“Some mortgage companies had stopped foreclosing on borrowers as they waited for details of the Obama administration’s housing-rescue plan, announced in February, which provides incentives for mortgage companies and investors to reduce borrowers’ payments to affordable levels. Others had temporarily halted foreclosures while they put their own programs in place, or in response to changes in state laws.
“Now, they have begun to determine which troubled borrowers are candidates for help, and to move the rest through the foreclosure process.
“The resulting increase in the supply of foreclosed homes could further depress home prices and put additional pressure on bank earnings as troubled loans are written off.”

Source: Ruth Simon, The Wall Street Journal, April 15, 2008.
Rebecca Wilder (News N Economics): More evidence that loan modifications may not put a floor under foreclosures
“The LA Times reports the broad results of a research paper produced at the Boston Fed, Reducing Foreclosures by Christopher L. Foote, Kristopher S. Gerardi, Lorenz Goette, and Paul S. Willen. According to the Times:
“‘Policies aimed at easing home loan terms for troubled borrowers may not be as effective in preventing foreclosures as more direct aid to homeowners, Federal Reserve economists have found.
“‘Job losses and falling home prices have a bigger effect on delinquencies than mortgage terms, and modifications aren’t necessarily a better deal for investors than foreclosures, two current and one former economist at the Boston Fed Bank and one Atlanta Fed researcher say in a paper posted Friday on the Boston Fed’s website.
“The results of this paper suggest that policies that encourage moderate, long-term reductions in DTIs [debt-to-income ratios] face important hurdles in addressing the current foreclosure crisis.
“Increasingly, borrowers are walking away from their mortgages, while at the same time, lenders may be unwilling to modify. This study suggests that Obama’s loan modification package may face some hurdles. To date, the results of government efforts to stem defaults are not encouraging.”
Source: Rebecca Wilder, News N Economics, April 11, 2009.
The New York Times: Big profits, big questions
“The question many Wall Streeters are asking is just how Goldman once again snatched victory from the jaws of defeat. Many point to Goldman’s expert manipulation of the levers of power in Washington … the firm has come to be known, as a headline in this newspaper last October put it, as ‘Government Sachs’.
“How can one ignore, the conspiracy-minded say, the crucial role that Henry Paulson, who followed Mr. Rubin to the top at both Goldman and Treasury, played in the decisions to shutter Bear Stearns, to force Lehman Brothers to file for bankruptcy and to insist that Bank of America buy Merrill Lynch at an inflated price? David Viniar, Goldman’s chief financial officer, acknowledged in a conference call yesterday the important role the changed competitive landscape had on Goldman’s unexpected firstquarter profit of $1.8 billion: ‘Many of our traditional competitors have retreated from the marketplace, either due to financial distress, mergers or shift in strategic priorities.’
“But he was largely mum on American International Group, which, Goldman’s critics insist, is the canvas upon which the bank and its alumni have painted their great masterpiece of self-interest. A few days after Mr. Paulson refused to save Lehman Brothers last September - at a cost of a mere $45 billion or so - he came to AIG’s rescue, to the tune of $170 billion and rising. Then he decided to install Edward Liddy - a former Goldman Sachs board member - as AIG’s chief executive. Goldman has since received some $13 billion in cash, collateral and other payouts from AIG - that is, from taxpayers …
“December 2008 was not included in Goldman’s rosy first-quarter 2009 numbers. In that month, Goldman lost a little more than $1 billion, after a $1 billion writedown related to ‘non-investment-grade credit origination activities’ and a further $625 million related to commercial real estate loans and securities. All told, in the last seven months, Goldman has lost $1.5 billion. But that number didn’t come up on Monday. How convenient …”
Source: William Cohan, The New York Times, April 14, 2009.
CNBC: Bove - Goldman raising $5 billion is wrong
“Goldman Sachs’ $5 billion capital raising is wrong, says Richard Bove, financial strategist at Rochdale Securities. He explains why to Michael Yoshikami, president & chief investment strategist at YCMNET Advisors & CNBC’s Maura Fogarty.”
Source: CNBC, April 14, 2009.
The New York Times: China slows purchases of US and other bonds
“Reversing its role as the world’s fastest-growing buyer of US Treasuries and other foreign bonds, the Chinese government actually sold bonds heavily in January and February before resuming purchases in March, according to data released during the weekend by China’s central bank.
“China’s foreign reserves grew in the first quarter of this year at the slowest pace in nearly eight years, edging up $7.7 billion, compared with a record increase of $153.9 billion in the same quarter last year.
“China has lent vast sums to the US - roughly two-thirds of the central bank’s $1.95 trillion in foreign reserves are believed to be in American securities. But the Chinese government now finances a dwindling percentage of new American mortgages and government borrowing.
“In the last two months, Premier Wen Jiabao and other Chinese officials have expressed growing nervousness about their country’s huge exposure to America’s financial well-being.
“Chinese reserves fell a record $32.6 billion in January and $1.4 billion more in February before rising $41.7 billion in March, according to figures released by the People’s Bank over the weekend. A resumption of growth in China’s reserves in March suggests, however, that confidence in that country may be reviving, and capital flight could be slowing.
“The main effect of slower bond purchases may be a weakening of Beijing’s influence in Washington as the Treasury becomes less reliant on purchases by the Chinese central bank.
“Asked about the balance of financial power between China and the US, one of the Chinese government’s top monetary economists, Yu Yongding, replied that ‘I think it’s mainly in favor of the US’.
“He cited a saying attributed to John Maynard Keynes: ‘If you owe your bank manager a thousand pounds, you are at his mercy. If you owe him a million pounds, he is at your mercy.’”
Source: Keith Bradsher, The New York Times, April 12, 2009.
Hans Lorenzen (Citigroup): High-grade credit’s turning tide
“The tide may finally have turned for the high-grade credit market, says Hans Lorenzen, strategist at Citigroup.
“‘Over the last two years, credit markets have stumbled from one bad headline to the next,’ he says. ‘However, we now get a sense the consensus has become so bearish that events may actually begin to surprise on the upside.’
“Mr Lorenzen notes credit spreads on investment-grade corporate bonds remain at levels not seen since the Great Depression. ‘So the mere improvement in the rate of decline in economic activity we expect later this year should allow a reduction in credit risk premia,’ he says.
“He also points to several other positives. ‘The G20’s commitment to boost funding to emerging markets is encouraging, and the market is more upbeat on the prospects for policy intervention.’
“But he still has concerns. ‘New issuance continues at a blistering pace, soaking up much of the cash coming into the sector. A long-anticipated rise in defaults is also occurring, and rating agencies are downgrading at a near record pace.
“He also acknowledges that many banks remain constrained in their ability to lend. Above all, economic activity data will stay dire for now. ‘Yet, we are inclined to think all this is factored in. While many problems still lie ahead, for the first time since the credit crunch began, we believe high-grade credit spreads have reached their peak.’”
Source: Hans Lorenzen, Citigroup (via Financial Times), April 14, 2009.
Rebecca Wilder (News N Economics): Corporate spreads still seriously elevated
“I hadn’t looked at corporate spreads in a while - the firm’s borrowing costs relative to the government’s borrowing costs. Recently, the government’s cost of borrowing for a term of 10 years, the 10-year Treasury rate, decreased with the Fed’s efforts to buy longer-term Treasuries. And the reason that the Fed is buying Treasuries is to lower borrowing costs faced by firms and households (corporate rates, mortgages, auto loans, etc.), which has evidently helped …
… but corporate spreads are still very, very elevated.
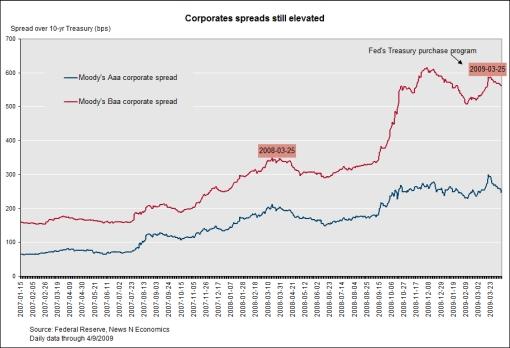
“The chart lists the 10-yr Aaa and Baa yields over the likewise Treasury rate (the corporate spread) in basis points (bps, essentially rate*100) reported by the Federal Reserve. Corporate spreads surged in March 2008 when the Fed lent money to JPMorgan in order to facilitate the takeover of Bear Stearns. That was a year ago; and since then, credit spreads have risen to record highs and then ebbed only slightly.”
Source: Rebecca Wilder, News N Economics, April 12, 2009.
Financial Times: Credit quality of global groups at 25-year low
“The credit quality of global companies has deteriorated to levels not seen for more than a quarter of a century, according to Moody’s Investors Service.
“The ratings agency said the ratio of companies having their credit ratings cut versus the number of companies being upgraded - an indicator of declining credit quality - had reached its highest level since 1983.
“During the first quarter of 2009, the rate at which borrowers were having their ratings cut reached 13.8%, highlighting the negative credit climate in the first part of the year, analysts at Moody’s said.
“‘This downgrade rate is higher than pre-economic crisis figures,’ said Jennifer Tennant, Moody’s analyst. For the whole of 2006, the downgrade rate was 10.2%, and the average rate from 1983-2009 was 12.5% per year.
“The fall in the ratio of companies’ credit ratings being upgraded was also grim. During the first quarter of 2009 the upgrade rate was just 0.5%, compared with an average upgrade rate between 1983 and 2009 was 7.9%. There were only four upgrades for every 100 downgrades.”
Source: Anousha Sakoui, Financial Times, April 12, 2009.
Reuters: Pimco to launch fund linked to US asset plan
“Pimco, the world’s largest bond fund manager, plans to launch a closed-end asset-backed fund linked to the US asset plan, TALF, in the next 30 days, and is exploring business opportunities in China, its Asia president and director said on Wednesday.
“Under the US plan to sop up bad assets now choking bank balance sheets, public-private funds will get opportunities to buy so-called ‘legacy’ securities with a combination of private and government capital, possibly levered up by the government.
“Pimco’s TALF Investment and Recovery Fund will borrow from the Term Asset-Backed Securities Loan Facility, or TALF, to buy securities backed by consumer receivables and loans, and will deliver income flows to investors via interest payments from the purchased assets, Brian Baker told Reuters in Shanghai.
“‘We believe this financial crisis will be resolved by the US and other core financial market rehabilitation. So we want to invest in these core countries where the financial rehabilitation will be led and where policy makers will be most aggressive in addressing the financial crisis,’ Baker said.
“Pimco, the world’s best known bond manager under chief investment officer Bill Gross, manages $747 billion, according to the company’s website.”
Source: Reuters, April 15, 2009.
CNBC: McCulley - Pimco’s plans for financials
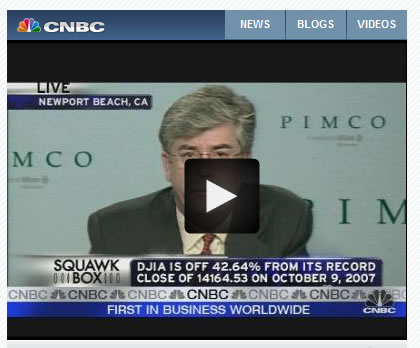
“The free-fall of the markets has been aborted and there is a bounce off a bottom, says Paul McCulley, Pimco portfolio manager/managing director.”
Source: CNBC, April 17, 2009.
Bespoke: S&P 500 moving average analysis
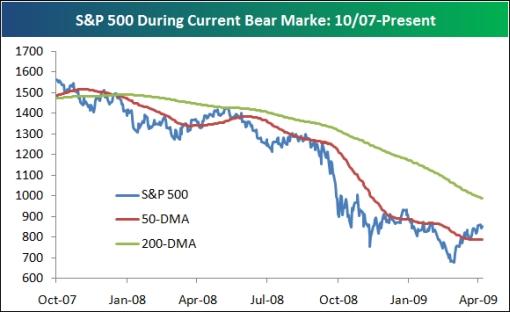
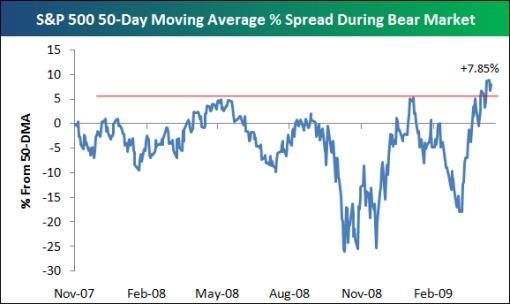
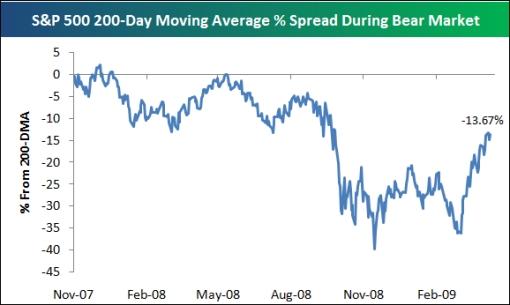
“The S&P 500 is currently trading above its 50-day moving average and below its 200-day moving average. The recent rally has also been one of the most impactful during the current bear market in regards to where the index is trading relative to both its 50- and 200-days.
“As shown in the second chart below, the S&P 500 is now 7.85% above its 50-day moving average, which is the most overbought reading for the spread since the bear market began. The index has also now traded above its 50-day for 11 days in a row, which is the longest streak since the 33-day period that ended last May.
“And finally, the S&P 500’s 200-day moving average spread is the highest it has been since the market really tanked last September. If the index can eventually trade above both its 50-day and 200-day, it will be a big positive for technicians looking for signs that the bear is officially over.”
Source: Bespoke, April 16, 2009.
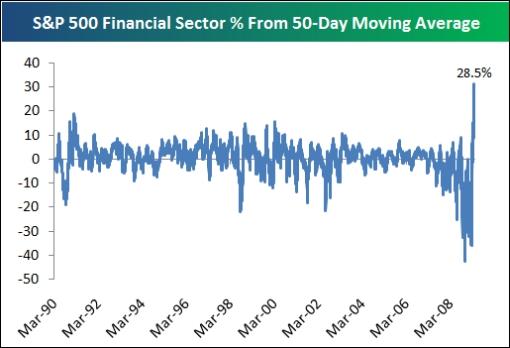
Bespoke: S&P 500 financial sector overbought
“The S&P 500 Financial sector is now 28.5% above its 50-day moving average. Below we highlight the historical 50-day moving average % spread for the sector going back to 1990 (as far back as daily sector pricing goes). As shown, just as the sector hit extremes on the oversold side in recent months, we’ve now hit extremes never seen before on the overbought side.”

Source: Bespoke, April 16, 2009.
Bloomberg: Russell 2000 rising 36% flashes warning for S&P rally
“The Russell 2000 Index’s record one-month gain is sending danger signals to investors who remember how similar rallies in US stocks came to an end.
“The gauge of companies with a median value of $301 million is beating the Standard & Poor’s 500 Index, where stocks have an average market value of $6.5 billion, by 9.8 percentage points through last week.
“While small-caps tend to lead the way out of bear markets, when they have outpaced larger stocks by this much, both indexes erased gains and fell, according to data compiled by Birinyi Associates. Increased trading and ratios of advancing to falling stocks have also risen to levels that preceded declines, boosting investor concerns that the S&P 500’s 27% advance since March 9 will end the same way as the 24% rally that fizzled in January.
“‘This move is too explosive to be sustainable,’ said Jack Ablin, chief investment officer at Chicago-based Harris Private Bank, which oversees $60 billion. ‘None of the structural underpinnings of the market have really changed. It’s going to be a multiyear healing process.’
“Mistaking a temporary jump for a sustained bull market can be costly. In 41 so-called bear market rallies since 1928 - gains of more than 10% that are later wiped out - equities fell an average 25% after peaking, according to Birinyi.
“‘Buying stocks is like crossing Fifth Avenue when the light is red,’ Birinyi said today in an interview with Bloomberg Television. ‘You might make it, but the odds are not with you.’”
Source: Lynn Thomasson, Bloomberg, April 13, 2009.
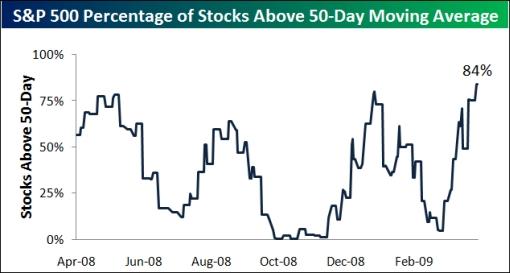
Bespoke: Percentage of stocks above 50-day moving averages
“After registering gains for five weeks in a row, there are now 84% of stocks in the S&P 500 trading above their 50-day moving averages. As shown below, this is the highest level over the last year.
“And six of the ten S&P 500 sectors have more than 90% of their stocks above their 50-days. Materials and Telecom are at 100%, while the Financial sector ranks third at 97%. Technology and Consumer Discretionary are at 95%, and Industrials is at 93%. Health Care has the second weakest breadth reading at the moment with only 51% of its stocks above their 50-days. And the most defensive sector in the market - Utilities - also has the smallest number of stocks above their 50-days at 49%.”
Source: Bespoke, April 13, 2009.
Richard Russell (Dow Theory Letters): Is this a true bear market bottom?
“… the market is now about one month off its March 9 low. Yet already the mood has changed, public sentiment is turning almost rosy, and analysts are openly urging people to buy stocks.
“The bear is doing its job. In less than a month, the Dow has recouped 20% of its 7,617 bear market losses. If the Dow was to retrace the normal one-third to one-half of its loss since late-2007, the following is where the Dow would be. A one-third recovery would take the Dow to 9,086. A one-half recovery would take the Dow to 10,355. Last Thursday the Dow ended the week at 8,083, which was 1,003 points short of a one-third recovery.
“It seems to me that this is awfully fast for the business news to turn rosy - only one month away from the March 9 ‘supposed’ bear market bottom. Bear market bottoms don’t tend to work that way. After a true bear market bottom, it often requires many months before the crowd and the media turn bullish.
“To repeat, I’m suspicious.”
Source: Richard Russell, The Dow Theory Letters, April 13, 2009.
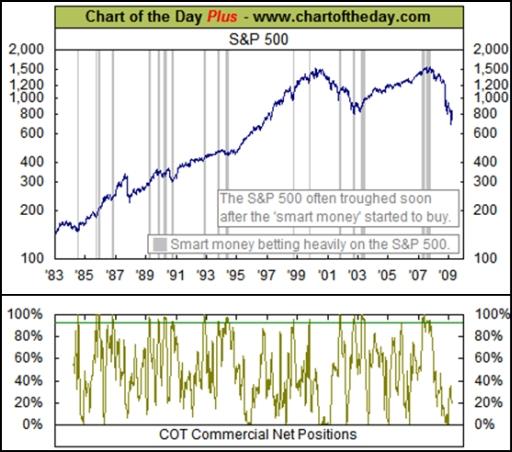
Chart of the Day: “Smart money” positioning themselves
“Today’s chart illustrates how large commercial institutions (i.e. “smart money”) are positioning themselves in the current market environment.
“When the gold line in the bottom chart is at a high level, it suggests that the smart money is betting on a rally. Large commercial institutions have tended to position themselves for a rally around the time of a stock market trough.
“One exception to this prescient ability occurred in 2007 when large commercial institutions became bullish just prior to the beginning of the current bear market. However, they did move to a bearish position prior to the financial collapse in the latter part of 2008.
“What is of particular interest with today’s chart is that the smart money has not moved back into the market since the financial collapse of 2008. This suggests that the smart money is viewing the current rally that began on March 9 as a bear market rally.”
Source: Chart of the Day, April 14, 2009.
CNBC: Mobius - investing in the next frontier
“An investing legend who started his first fund at the same time of CNBC’s launch sheds light on emerging-market problem spots and opportunities, with Mark Mobius, Templeton Asset Management managing director.”
Click here for a Globe and Mail interview with Mobius.
Source: CNBC, April 17, 2009.
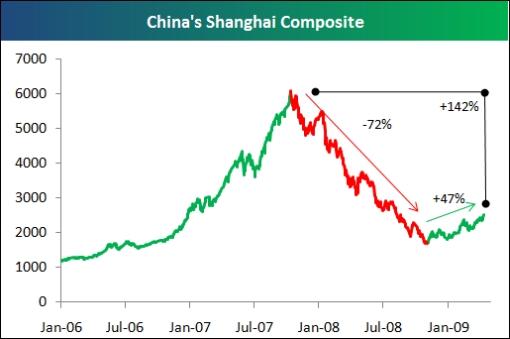
Bespoke: Emerging markets on a tear?
“The Wall Street Journal has an interesting article in its Money & Investing section today titled “Emerging Markets Go on a Tear“. China is one of the countries highlighted, which is now up 47% from its lows late last year. As shown below, however, China’s Shanghai Composite still has a long, long way to go before it makes a dent in the losses it experienced in ‘07 and ‘08. As shown, even after its 47% run, the index needs to gain 142% to reach its old highs. From its peak, China is still down 59%.
“Conversely, the S&P 500 is down 46% from its peak and only needs to gain 84% to reach its old highs. Emerging markets like China have rallied significantly, but since its starting base was so low, its market is still in worse shape than the US.”
Source: Bespoke, April 13, 2009.
CEP News: Bernanke says US dollar will remain dominant currency
“The US dollar remains the dominant world currency and US Treasuries remain a sound investment, Federal Reserve Chairman Ben Bernanke said in Atlanta, Georgia on Tuesday.
“In a Q&A session after his speech Bernanke said he does not see the US dollar’s role changing in the foreseeable future.
“The comments come after news reports that China is attempting to push wider use of the yuan in global markets. China has signed currency swap contracts with six nations since December 2008.
“China has also alluded to worries about the value of US bonds.
“Bernanke did address the US deficit problem in his speech on Tuesday, and said the government needs a plan to reduce long-term fiscal imbalances.
“For the time being, however, he said they have no choice but to spend.”
Source: Megan Ainscow, CEP News, April 14, 2009
Fin 24: Zim dollar shelved for a year
“Zimbabwe will not use its own local currency for at least a year, a state newspaper reported on Sunday, while it tries to repair an economy which critics say was destroyed by President Robert Mugabe.
“The southern African state has allowed the use of multiple foreign currencies since January to stem hyperinflation which had rocketed to over 230 million percent and left the Zimbabwe dollar almost worthless.
“The state-controlled Sunday Mail said the unity government of Mugabe and opposition leader Morgan Tsvangirai decided the Zimbabwe dollar should only be reintroduced when industrial output reaches about 60% of capacity from the current 20% average.
“‘The Zimbabwe dollar will be out for at least a year. We resolved that there will be no immediate plans to (re)introduce the money because there is nothing to support and hold its value,’ the newspaper quoted Economic Planning and Development Minister Elton Mangoma as saying.
“‘Our focus is to first ensure that we have a vibrant industry. If we try to reintroduce the local currency now, it will face the same fate of being wiped out of its value within weeks.’
“Critics say Mugabe, who has led Zimbabwe since independence from Britain in 1980, has destroyed one of Africa’s most promising economies through controversial policies, including the seizure of white-owned commercial farms for redistribution to inexperienced black farmers.
“Mugabe, 85, denies the charge and says the economy has been sabotaged by enemies opposed to his nationalist policies.”
Source: Fin 24, April 12, 2009.
Eoin Treacy (Fullermoney): Gold in no-man’s land
“Gold continues to go through a difficult phase as other commodities and stock market sectors move to relative outperformance. Gold, and other so-called ‘safe havens’ such as the US dollar, yen and Treasuries, have all retreated from their highs and remain vulnerable as long as the global appetite for risk continues to increase. However gold is different from these three vehicles, since it can be classed as real money rather than a paper asset whose supply depends on the whim of governments.
“Gold found support above the 200-day moving average last week, but needs to sustain a move back above $900 to indicate more than a temporary return of demand at that level. A sustained move above $967 would break the short-term progression of lower highs and a push back above $1,000 is needed to reassert the overall uptrend.”
Source: Eoin Treacy, Fullermoney, April 14, 2009.
Financial Times: Oil falls as IEA cuts demand forecast
“Oil prices fell below $50 a barrel on Monday after the International Energy Agency, the energy watchdog, reduced its demand forecast for the year.
“The IEA reported on Friday that global oil demand this year would fall by 2.4 million barrels a day as inventories in developed countries hit their highest levels in 16 years.
“This overshadowed the news that China’s daily crude oil imports rose to year highs in March, suggesting demand in the world’s second-biggest oil importer was starting to recover.
“However, Edward Meir at MF Global said: ‘It is important to remember that import levels are skewed by the fact that the government controls energy prices, so the ‘blip’ needs to be seen in that context.’”
Source: Neil Dennis, Financial Times, April 13, 2009.
Bloomberg: OPEC cuts thwarted as Brazil, Russia grab US market
“As OPEC nations make their biggest oil production cuts on record, Brazil and Russia are pumping more, threatening to send crude back below $50 a barrel as demand slows.
“US imports from the Organization of Petroleum Exporting Countries fell 818,000 barrels a day, or 14%, to 5.02 million in January from a year earlier, according to the latest monthly report from the Energy Department. At the same time, imports from Brazil more than doubled to 397,000 and Russia’s increased almost 10-fold to 157,000, a trend that continued in February and March, according to data from each country.
“While the median forecast in a Bloomberg News survey of 32 analysts shows crude in New York averaging $61 a barrel in the fourth quarter, up from the second-quarter’s estimate of $50, traders are increasing bets on a decline. The fastest-growing options contract on the New York Mercantile Exchange is for prices to fall below $40 a barrel by May 14.
“‘OPEC has done a good job keeping oil in the $50 area, but they will have to cut substantially more, maybe more than they are capable of, if they want higher prices,’ said John Kilduff, senior vice president of energy at MF Global in New York. ‘You are going to hear greater calls for non-OPEC producers to cooperate and make cuts.’”
Source: Mark Shenk, Bloomberg, April 14, 2009.
Newsweek: Rogers on commodities
“Jim Rogers, the legendary American investor, financial commentator and, along with George Soros, founder of the Quantum Fund, is the ultimate commodities bull. More than 10 years ago, he started the Rogers International Commodities Index, and in 2005 he wrote ‘Hot Commodities: How Anyone Can Invest Profitably in the World’s Best Market’. Below, he explains to Newsweek’s Rana Foroohar why oil is still black gold.
Foroohar: Inflation-adjusted, oil is the same price that it was in 1976, and in 1870. So why are you still a bull?
Rogers: It doesn’t matter. It’s also true that just about any stock you can think about is at or below where it was in the 1970s right now. So what? There are still 15- to 20-year periods when commodities, stocks and any other asset class goes up a great deal. In 1987 stocks collapsed by 40-80%. But people who were smart enough to stay in them made 1,000% returns in the next decade. The point is to take advantage of those periods and make some money.
What’s the fundamental case for commodities right now?
Supply is declining. There’s been 35 years of low investment in production capacity. The last lead smelter in the US was built in 1969! There’s been no major oilfield discovery in 40 years. Oil is in decline. According to the International Energy Agency, oil reserves are declining significantly. At this rate, in 20 years, there will be no oil left. The only people to make money in the next 20 years will make it in commodities. It’s the only asset class where the fundamentals are improving. I mean, look at Citigroup, look at GM. Those fundamentals are not improving.
Do you see commodities as an inflation hedge?
Absolutely. This is only time in history where you’ve got every central bank in the world printing money at the same time. Consumer prices are going to go way up. The public is already getting out of paper money, which is why you’re seeing gold go up.
Does the future growth of China factor into your bullishness?
China is tiny in comparison to the US economy. Anyone who thinks that the commodities story is driven by China needs to do more homework. In the 1970s, everyone was in recession, and you still had declining supply [in oil] and higher prices. Asia wasn’t even in the game then. China was run by Mao. But now, of course, there are those 3 billion people in Asia who are in the game. It’s just another factor.”
Click here for the full article.
Source: Rana Foroohar, Newsweek, April 11, 2009.
Financial Times: Beijing struggles to prop up growth
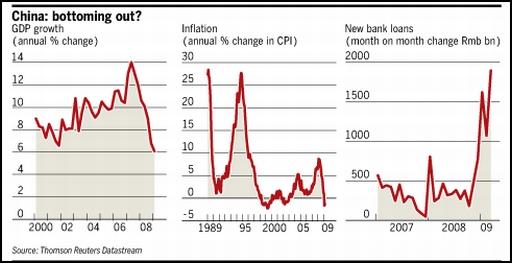
“China’s economy grew at an annual rate of 6.1% in the first quarter - its slowest pace since quarterly gross domestic product data was first published in 1992 - as Beijing struggled to prop up activity in the face of the global crisis.
“The increase was down from 10.6% growth in the same period a year earlier and 9% for the whole of 2008 but aggressive government stimulus measures begun in the fourth quarter last year have started to yield signs of recovery.
“The figure was ‘indeed quite an achievement’ against the background of the worsening global crisis and recession in many of the developed economies that China relies on to buy its exports, said Li Xiaochao, spokesman for the National Bureau of Statistics.
“Rapid cooling in the Chinese economy has been led by a collapse in exports and private sector investment. This has prompted the government to fast-track infrastructure projects and spending programmes, and order state-run banks to open the credit taps to flood the system with liquidity.
“Although there is still little evidence of new private sector investment, the government’s efforts have led to a rebound in investment figures and show signs of stimulating wider demand in the economy.
“Sun Mingchun, an economist at Nomura Securities, said economic data released on Thursday ‘showed that the economy has gained significant momentum since February’.
“The decline in Chinese exports decelerated in March, with exports falling 17.1% from a year earlier, compared with a 25.7% decline in February, leading some analysts to predict a stabilisation in trade. Others said further weakness in external demand was the main risk.”
Source: Jamil Anderlini, Financial Times, April 16, 2009.
James Pressler (Northern Trust): China - so much for fast recoveries
“It is not normally like us to say ‘we told you so’, but the release of briskly-compiled Q1 GDP figures for China provides a compelling argument to use that phrase - not that we would. The numbers came in below consensus, and should put to rest for the moment any suggestions that China is somehow amazingly resilient to global contagion.
“In our comment on April 2 we pondered over surprisingly high confidence figures suggesting that Q1 would show the first stages of a rebound. We had our doubts, and indeed, the 6.1% year-over-year growth figure was the worst posted since 1991. Now this figure is nothing to scoff at, but when any country experiences a slowdown in economic activity of at least four percentage points in less than a year, people should take notice.
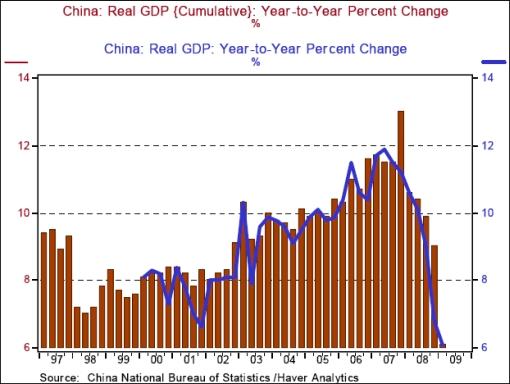
“However, we do see some bright spots in today’s figures. Considering how dramatically export demand and other external indicators have fallen, the Q1 figure did not follow in step, which suggests that the first signs of Beijing’s fiscal stimulus are finding their way into the national accounts. (This would be the minor stimulus package announced prior to the Beijing Games, when the government offered additional spending to counter the effects of ‘Olympic hangover’.) This might just be enough to keep growth above the 6.0% mark until the real fiscal stimulus package kicks in and the ultra-high amounts of bank lending since November turn into real economic activity.
“Our wager is that Q2 GDP hovers right at the 6.0% level before a slow migration north, though underlying (and unreported) base effects in the data could put some variance in that movement. The overall trend, however, looks like a slow recovery starting in Q3.”
Source: James Pressler, Northern Trust - Daily Global Commentary, April 16, 2009.
Financial Times: Singapore’s economy sags as exports slow
“Singapore’s trade-dependent economy contracted by a record 11.5% in the first three months of 2009 from a year ago as exports fell by 17% in March, the 11th consecutive month of declines.
“The sharper than expected deterioration in the economy’s performance, after it contracted by 4.2% in the fourth quarter of 2008, forced the government to revise downward its full-year forecast to between minus 6% and minus 9%, making it Singapore’s worst postwar recession.
“The Monetary Authority of Singapore, the de facto central bank also devalued slightly the currency as it re-centred the secret policy band that pegs the Singapore dollar to a basket of international currencies.
“The latest data revealed the plunge in exports is slowing from a 35% drop in January and 24% in February. But there are worries that the continued weakness in the US economy will hurt exports for the rest of the year.
“Another warning sign is that the quarter-on-quarter decline in gross domestic product accelerated to 19.7% between January and March from 16.4% in the fourth quarter of 2008 as the economic slowdown spread to other trade-related domestic sectors, including transport and financial services.
“But economists believe that the dire figures for the first quarter could indicate that the economy has touched bottom and might start recovering or at least stabilise as the pace in the decline in export slows.”
Source: John Burton, Financial Times, April 14, 2009.
CNBC: Impact of political unrest on Thai markets
“Discussing how the political unrest in Thailand will impact investor sentiment, with Nicholas Kwan, regional head of research, Asia at Standard Chartered Bank, speaking with CNBC’s Karen Tso.”
Source: CNBC, April 15, 2009.
CEP News: UK house prices continue to slide
“The decline in UK house prices failed to abate in February, according to a report from the Department for Communities and Local Government (DCLG) on Wednesday.
“The DCLG’s house price index for the UK declined to 158.7, compared to January’s reading of 164.2.
“On an annual basis, the index is down 12.3% in February, a sharper decline than January’s 11.5% contraction.
“The report also suggests that the contraction is broad based with house prices in London falling 12.3% and prices outside the capital also falling 12.3% on the year.”
Source: Erik Kevin Franco, CEP News, April 15, 2009.
YouTube: Dow Jones by Downsize
“Dow Jones” is Downsize’s first single off their album “Going Out Of Business”. The video also features Nicole O’Connell.
Source: YouTube, March 2, 2009.
By Dr Prieur du Plessis
Dr Prieur du Plessis is an investment professional with 25 years' experience in investment research and portfolio management.
More than 1200 of his articles on investment-related topics have been published in various regular newspaper, journal and Internet columns (including his blog, Investment Postcards from Cape Town : www.investmentpostcards.com ). He has also published a book, Financial Basics: Investment.
Prieur is chairman and principal shareholder of South African-based Plexus Asset Management , which he founded in 1995. The group conducts investment management, investment consulting, private equity and real estate activities in South Africa and other African countries.
Plexus is the South African partner of John Mauldin , Dallas-based author of the popular Thoughts from the Frontline newsletter, and also has an exclusive licensing agreement with California-based Research Affiliates for managing and distributing its enhanced Fundamental Index™ methodology in the Pan-African area.
Prieur is 53 years old and live with his wife, television producer and presenter Isabel Verwey, and two children in Cape Town , South Africa . His leisure activities include long-distance running, traveling, reading and motor-cycling.
Copyright © 2009 by Prieur du Plessis - All rights reserved.
Disclaimer: The above is a matter of opinion and is not intended as investment advice. Information and analysis above are derived from sources and utilizing methods believed reliable, but we cannot accept responsibility for any trading losses you may incur as a result of this analysis. Do your own due diligence.
Prieur du Plessis Archive |
© 2005-2022 http://www.MarketOracle.co.uk - The Market Oracle is a FREE Daily Financial Markets Analysis & Forecasting online publication.


