


Performance of Key Asset Types Over Several Time Frames
Stock-Markets / Investing 2009 Apr 16, 2009 - 02:37 PM GMTBy: Richard_Shaw

 Someone on Bloomberg TV today said we have moved from an apocalyptically bearish to a reluctantly bullish market. That is probably a fair statement for the the moment. Someone else a couple of weeks ago said we have gone from a death spiral in the economy to a period of slow rate of economic decline. Then someone else said, the economy is not going up, but it is going down at sufficiently slower rate that it almost feels like up.
Analyst predictions for earnings and valuation multiples are split. Uncertainties as to government policy with respect to banks and auto companies remain high. We continue to be in a government policy driven markets situation.
How is all that translating into price behavior of key asset types? In the end, prices talk and opinions walk.
US Assets:
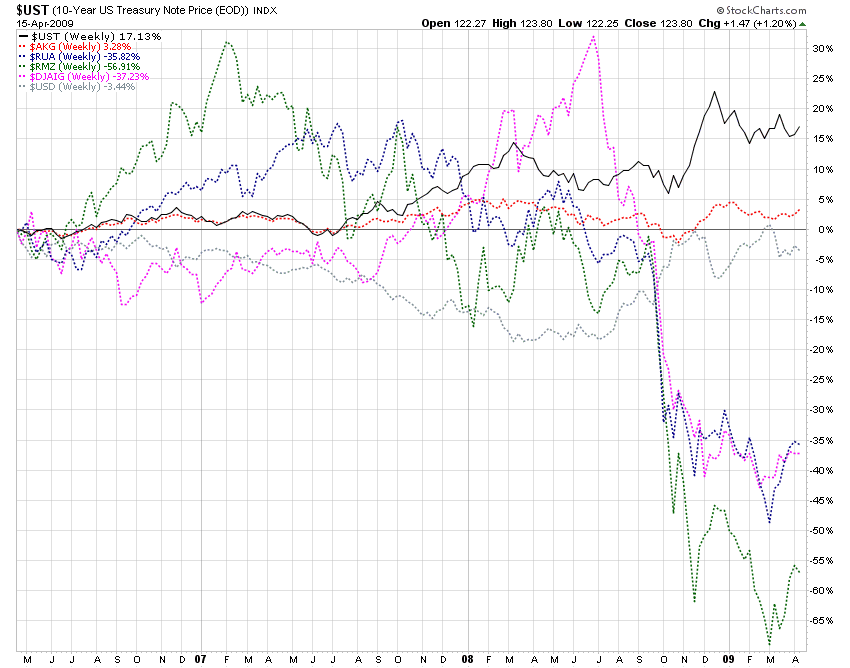
Let’s look at 3-year, 1-year and 3-month price percentage change performance charts for these US key asset types, plus global commodities:
- US 10-Yr Treasuries (black)
- Barclay’s US Aggregate Bonds (red)
- Russell 3000 US Stocks (blue)
- MSCI US Equity REITs (green)
- DJ-AIG Global Commodities (pink)
- US Dollar (gray)
3-Years
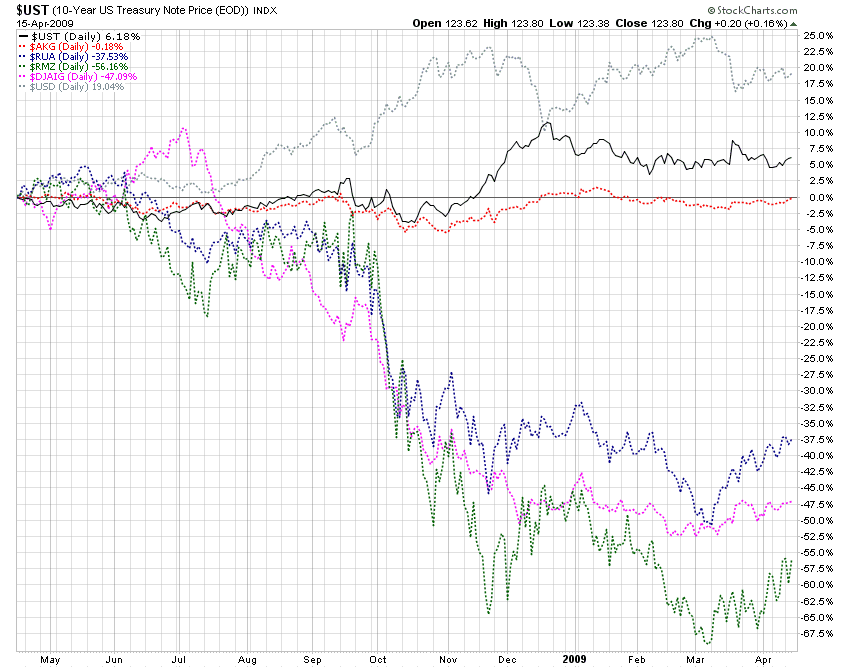
1-Year
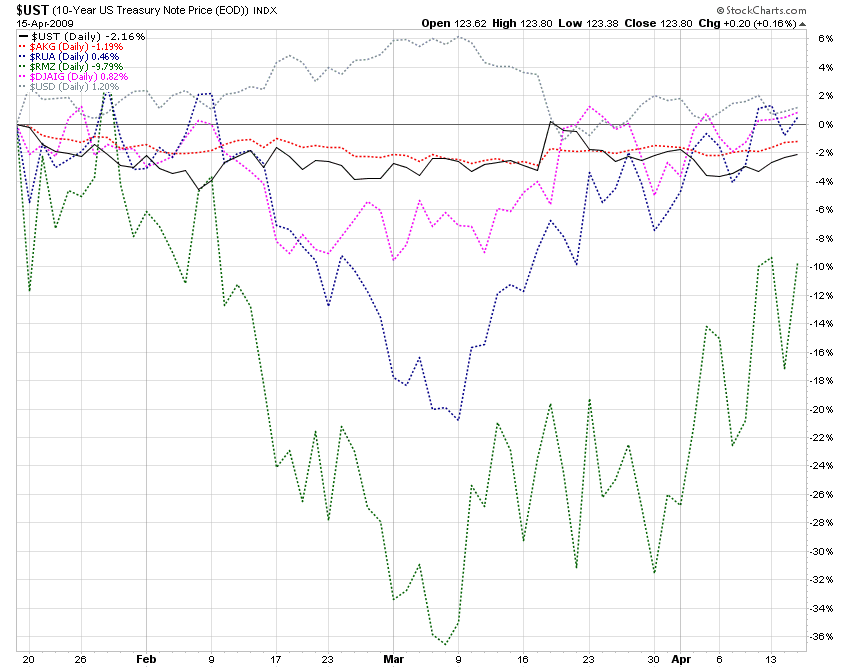
3-Months
Aggregate bonds have been generally steady, except for the short spike down in October 2008. Treasuries have risen substantially due to the rush for cover, but have been flat to slightly down this year as the fear factor has moderated.
Equity REITs are way in the basement, but just recently have been rising strongly from a low base. Today’s huge General Growth Properties bankruptcy filing couldn’t be helpful, although the move has been anticipated for some time.
Composite commodities have been strong in the last few months, but not as strong as US stocks which are just now back in positive territory for three months after their swan dive in March.
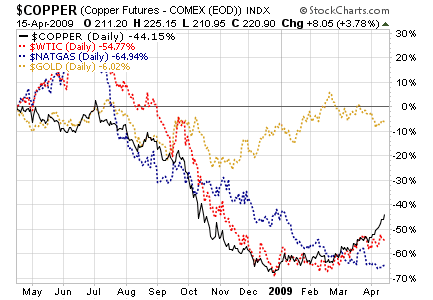
The overall commodities indexes are not as vibrant as some of the sub-components. Gold has held up reasonably well over the past year, while copper and oil seem to have formed a base and turned up. Natural gas is still solidly down.
US and Non-US Stocks:
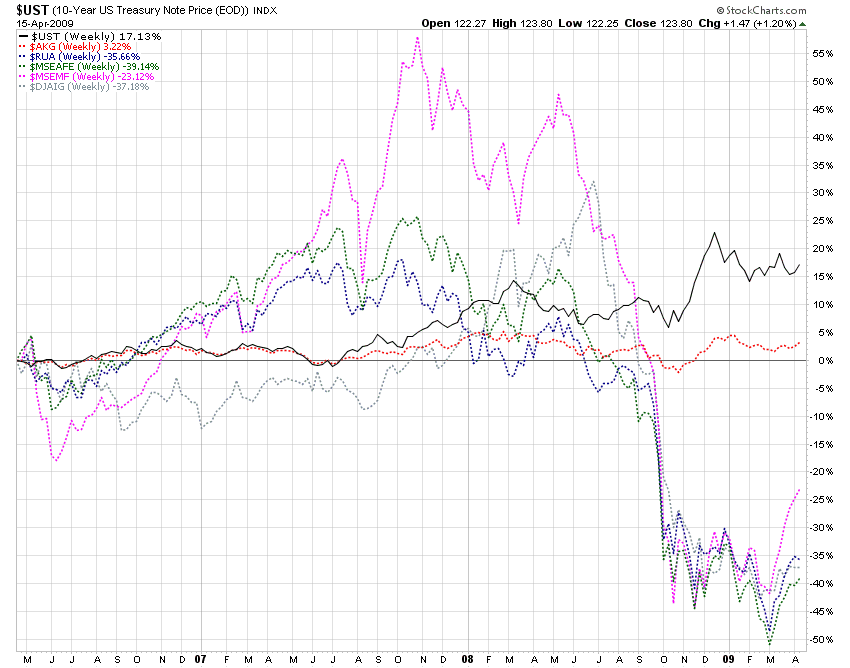
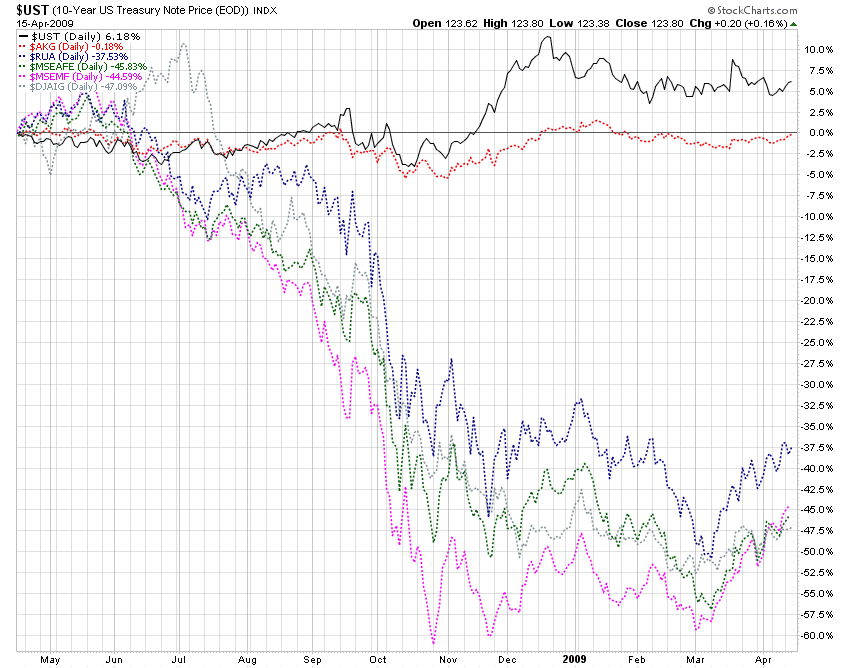
Now let’s look at 3-year, 1-year and 3-month price percentage change performance charts for US and non-US stocks plus commodities, and US bonds as a risk benchmark:
- US 10-Yr Treasuries (black)
- Barclay’s US Aggregate Bonds (red)
- Russell 3000 US Stocks (blue)
- MSCI EAFE (developed) Markets (green)
- MSCI Emerging Markets (pink)
- DJ-AIG Global Commodities (gray)
3-Years
1-Year
3-Months
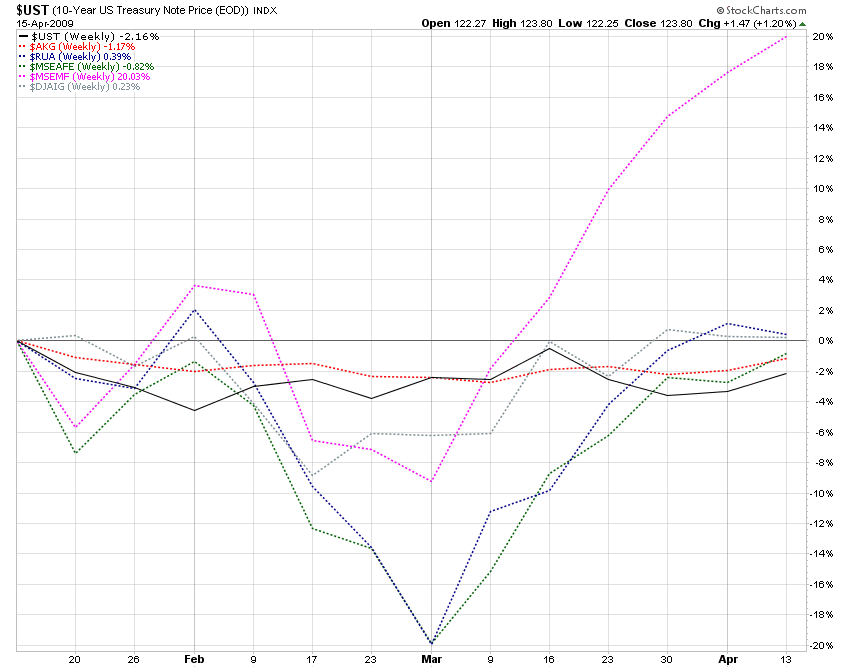
Emerging markets are clearly the investment story. They rose the most before the 2008 crash. They fell the most during the crash. Now they are rising the most. Our ETF price pattern screen yesterday also confirms that trend with the high concentration of emerging market funds among those with demonstrated short-term upward movements.
While US and EAFE markets have reclaimed essentially all of the losses they experienced at the bottom of the past three months, emerging markets have ballooned up.
By Richard Shaw
http://www.qvmgroup.com
Richard Shaw leads the QVM team as President of QVM Group. Richard has extensive investment industry experience including serving on the board of directors of two large investment management companies, including Aberdeen Asset Management (listed London Stock Exchange) and as a charter investor and director of Lending Tree ( download short professional profile ). He provides portfolio design and management services to individual and corporate clients. He also edits the QVM investment blog. His writings are generally republished by SeekingAlpha and Reuters and are linked to sites such as Kiplinger and Yahoo Finance and other sites. He is a 1970 graduate of Dartmouth College.
Copyright 2006-2009 by QVM Group LLC All rights reserved.
Disclaimer: The above is a matter of opinion and is not intended as investment advice. Information and analysis above are derived from sources and utilizing methods believed reliable, but we cannot accept responsibility for any trading losses you may incur as a result of this analysis. Do your own due diligence.
Richard Shaw Archive |
© 2005-2022 http://www.MarketOracle.co.uk - The Market Oracle is a FREE Daily Financial Markets Analysis & Forecasting online publication.