


Gold Sentiment and its Relative Trend Picture
Commodities / Gold & Silver 2009 Apr 16, 2009 - 11:19 AM GMTBy: Jordan_Roy_Byrne

 While I continue to believe that the next breakout in Gold is still months away, we have seen in just a short while, some very encouraging signs on the sentiment front. Accumulating is certainly a wiser prospect now that the luster of the metals has faded yet only superficially.
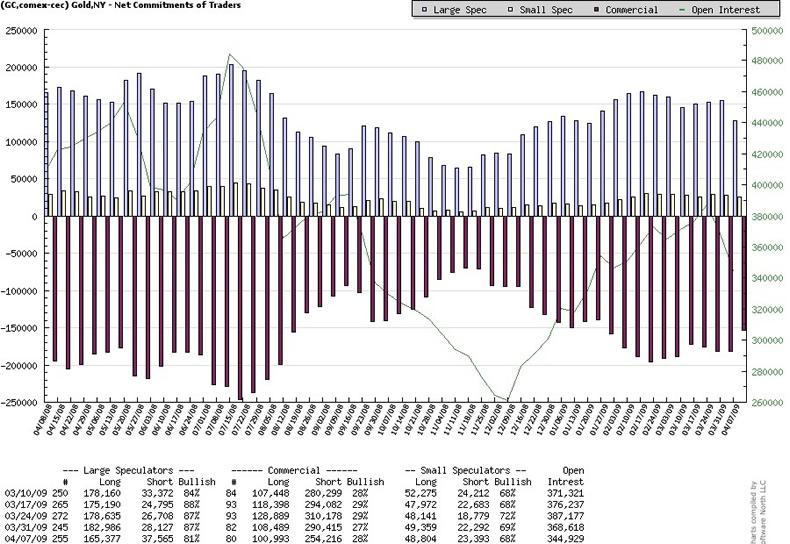
Below is a chart from softwarenorth.net of the Commitment of Traders data on Gold. The week Gold fell below $880, the net position of commercial traders declined from short 182K contracts to short 153K contracts. Open interest declined from 368K to 344K. It is a positive but doesn’t signal a bottom by any means. Traders and investors should key on this data in addition to watching the price of Gold as it tests certain support levels such as $850, $820 and perhaps $800.
A sure positive for Gold is the COT data for Silver. The price of Silver has held up very well while the COT data has continued to improve. Usually it takes large declines in price to see a decline in commercial short positions. Below you can see that commercial short positions have steadily declined over the past five weeks while the price of silver has held up very well. Furthermore, both open interest and the net position of the commercials are very close to the levels seen in late 2008 when the market was bottoming.
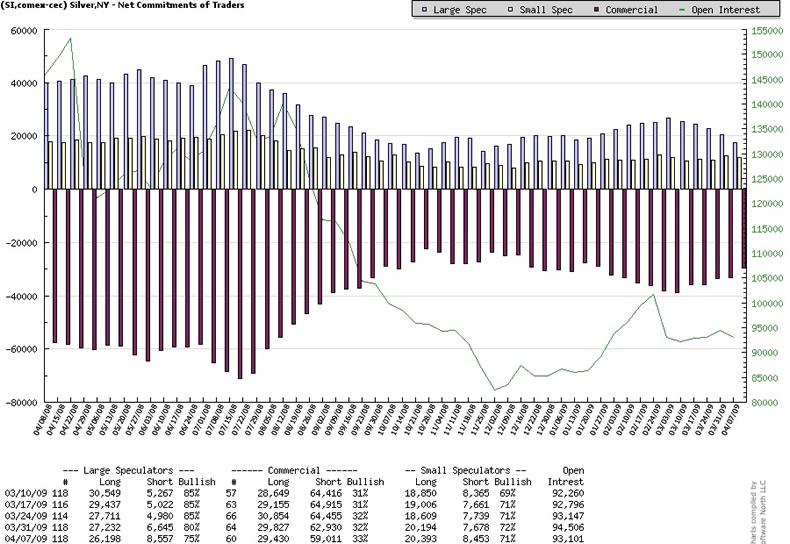
Usually when the precious metals market is overheated, Silver will be overextended the most. In the current situation, Silver looks better than Gold in terms of sentiment. It shows that speculation in the sector is minimal. Moreover, how much have you heard about Silver in the last few months? Usually when Gold is roaring, you will hear some mention of Silver. Weeks ago Gold was near $1,000 and I can’t remember any coverage of Silver from any of the business channels or major papers.
Getting back to Gold, some mainstream financial media is quickly forgetting about Gold. Take a look at this recent clip from CNBC’s Fast Money.
http://www.thefinancialtube.com/video/2938/Gartman-Play-Boring-Stocks
To be fair to Guy Adami, Joe Terranova and Dennis Gartman, they didn’t say they were long-term bearish though they pretty much wrote Gold off for the short and medium term. These guys are primarily momentum players so it is a good sign that they are out of the market and their negativity is also a good sign.
Aside from charting Gold by itself, we should take a look at how it’s faring against other markets. Weeks ago we wrote that Gold wouldn’t go through $1,000 because it was too extended against the various markets, which were in the early stages of a recovery. Let’s see how things are shaping up for Gold in relative terms.
Below is a chart of Gold divided by the Continuous Commodity Index, symbol CCI. The ratio has declined 19% from its peak and is finding support at the 38% retracement. At the bottom, I show the %B indicator for 50 days and 100 days. It suggests that the ratio is oversold in the short term but still has some correction to go in terms of 100 days or the medium term. My view is that Gold/Cci has completed the first leg down and the market will find a bottom during the second leg down. I don’t see a lot more downside in terms of price, as there is significant support at 2.20.
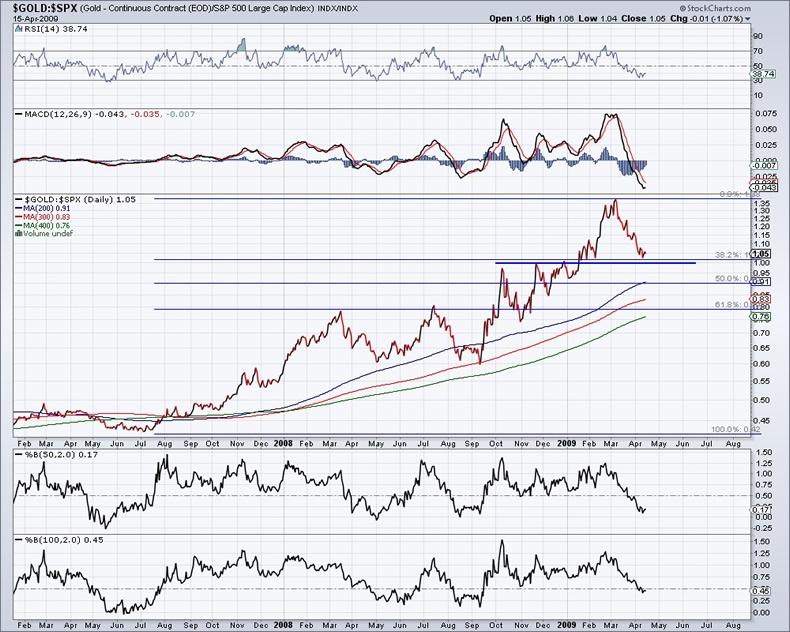
Moving along lets take a look at Gold against the S&P 500. The relative situation looks the same for Gold when compared to stocks. The chart has completed the first corrective leg, as it is finding support at the 38% retracement. The ratio has declined 22% since reaching its peak. I don’t see the ratio going below the 50% retracement at 0.91. Like the other ratio, the correction needs more time to complete but most of the price damage has already been done.
Conclusion
From a contrary perspective, sentiment on Gold has improved materially, as the metal was unable to hold $880. However, it is still not quite where it needs to be for us to call Gold a strong buy. Hence we are looking for another decline through $850 to $820. Also, it is probably too late to do a “short gold long ___” trade. Relatively speaking, most of the “price” correction may be complete, but there is plenty of time to go. In addition to charting Gold by itself, traders and investors should key on these ratio charts as they often lead Gold higher.
By Jordan Roy-Byrne
trendsman@trendsman.com
Editor of Trendsman Newsletter
http://trendsman.com
Trendsman” is an affiliate member of the Market Technicians Association (MTA) and is enrolled in their CMT Program, which certifies professionals in the field of technical analysis. He will be taking the final exam in Spring 07. Trendsman focuses on technical analysis but analyzes fundamentals and investor psychology in tandem with the charts. He credits his success to an immense love of the markets and an insatiable thirst for knowledge and profits.
Jordan Roy-Byrne Archive |
© 2005-2022 http://www.MarketOracle.co.uk - The Market Oracle is a FREE Daily Financial Markets Analysis & Forecasting online publication.