Risk Aversion Returns as Stock Markets Fail at Resistance
Currencies / Forex Trading Apr 15, 2009 - 04:59 PM GMTBy: Ashraf_Laidi

 Global risk aversion gradually returns as equity indices struggle in passing the earnings test. Our oft-mentioned 860-865 target in the S&P500 denoting the +30% rally mark from the March low was tested without success, further highlighting the significance of the implications for the latest equity rally. Although the S&P500 breached above the 50 and 100-day moving averages, these moving averages stand halfway between the 200-day MA (989) and the March low (666).
The wide disparity between the 100 and 200 day MAs in US indices highlights the speed of the recent advances as they managed to breach above medium term trend measures (50 and 100-day MAs) but still remain far below the longer trend measure (200-day MA) which remains dwarfed by the longer-term trend.
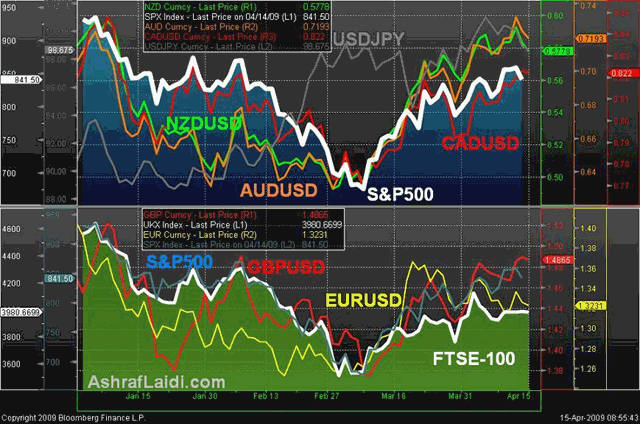
While the relationship between equities and currencies evolved since the ongoing retreat in volatility 4 weeks ago, the principal rule of behind risk and lower yielding currencies continues to hold. The upper chart shows the relationship between the S&P500 and selected currency pairs with notably positive correlation. AUDUSD and USDCAD (expressed in inverted terms on chart as CADUSD) have shown the highest correlation with the S&P500 since March (recovery in stocks) at 0.78 and -0.77 respectively--but for different reasons.
Aussies correlation with equities had been more robust during a rising market, while the loonies correlation with equities had been slightly higher during a falling market. NZD continues to attract strong selling interest against USD and JPY during falling equities due to lingering negativism and expectations of at least 50-bps in RBNZ rate cuts. The Canadian dollar has largely benefited from a rebound in oil prices and steady oil prices, but the looming threat of quantitative easing from the Bank of Canada as well as the lagging effect of US macro-deterioration on Canada raises doubts about the credibility of the loonie's advances.
The lower chart graphs the relationship between GBPUSD, EURUSD, FTSE-100 and S&P500. Since Jan 1st, GBPUSD showed overall weak daily positive correlation with the S&P500 and FTSE-100 at 0.33 and 0.28 respectively. The correlation remained weak even during the years worst 4-week period (Feb 9th- Mar 9th). In contrast, EURUSD, proved more positively correlated with S&P500 and FTSE-100 at 0.67 and 0.35 during a falling market (Feb-Mar) and a rising market (Mar 9th Apr 9th) at 0.38 and 0.20. The analysis highlights sterlings recent advances relative to EUR especially amid the lack of negative UK news and Barclays successful sale of I-Shares, which implies no needed government protection for the bank. In general, EUR and GBP remain best correlated with stocks when traded against JPY (despite similarly low rates with USD) than against USD.

Despite sterling's stellar performance (highest overall return month-to-date in a universe of 11 major currencies), the rally shows increased signs of tapering off. The absence of real economic data from the UK has often proved a temporary booster for the currency over the past 2 years. Despite its newly acquired low yielding status, sterling continues to behave as a risk currency, rallying during improved market sentiment. The vacuum of news on the UK banking front has also been a factor. But as the IMF sets to officially release its latest estimates for global banking losses next week--reportedly standing as much as $4 trillion from the already reported $1.3 trillion since the start of the crisisa renewed pullback in financials will likely drag sterling anew. Recall that the IMF was widely ridiculed a year ago when it announced its initial estimates for banking losses to reach $1.0 trillion.
Chapter 5 of my book devotes 25 pages on the topic of "Risk Appetite in the Markets" with illustrative case studies in FX, VIX, equities and coporate bond spreads.
JPY crosses may have staged a gradual recovery after touching our projected targets on Tuesday courtesy of US retail sales and negative earnings from Intel. But just as S&P500 struggled in crossing above the 29% threshold from the 666 lows beyond 860-870, USDJPY remains unable to breach above 101.60 resistance, an increasingly prominent signal of traders reluctance to sell the Japanese currency beyond a point thats deemed excessive as far as FX risk appetite.
The level marks the 61.8% retracement of the decline from the August high of 110.7 to the to the January low of 87.13. Interim resistance stands at 100.60. The duration of carry trades remain selective, with the more prolonged gains (and short-lived losses) seen in Aussie due to a limited scope for RBA rate cuts relative to G10 central banks (quantitative easing included). Not only Aussie rates are expected to near their bottom, but they could do so at a relatively hefty 3.25%, which is higher than all G10 currencies. Aussies recent 6-month high of 0.7320 drew near the 200-day MA of 0.7350, a long term benchmark not breached since August. The Aussie story is now well cemented into the psyche of institutional and retail investors, especially given its limited pullbacks during risk aversion (reduced appetite).
By Ashraf Laidi
AshrafLaidi.com
Ashraf Laidi is the Chief FX Analyst at CMC Markets NA. This publication is intended to be used for information purposes only and does not constitute investment advice. CMC Markets (US) LLC is registered as a Futures Commission Merchant with the Commodity Futures Trading Commission and is a member of the National Futures Association.
Ashraf Laidi Archive |
© 2005-2022 http://www.MarketOracle.co.uk - The Market Oracle is a FREE Daily Financial Markets Analysis & Forecasting online publication.


