Goodbye to the Stock Market Rally?
Stock-Markets / Stocks Bear Market Apr 15, 2009 - 12:13 PM GMTBy: Mike_Shedlock

 The market rallied on great Wells Fargo news. However, I am skeptical if not outright cynical of such bullishness. I am not the only one.
Minyan Peter, one of the best reads anywhere, seems to agree. Please consider Goldman Sachs: Green This Morning, Hurricane Tonight?
Last night, Goldman Sachs (GS) announced its first-quarter earnings early, following Wells Fargo's (WFC) early release last Thursday.
From my perspective, corporations only accelerate positive earnings news under 2 conditions: a) There's serious market doubt about the ongoing viability of the company, or b) The company wants to take advantage of the good news to issue securities (debt or stock), and the lawyers require updated disclosure.
As longtime Minyans know, I believe that companies only issue common stock under 2 circumstances: a) when they absolutely have to, and b) when they're stupid not to. And it's with these criteria that I evaluate every stock offering.
....
But everything feels very rushed -- albeit highly choreographed -- as if both Washington and Wall Street (and dare I add Omaha, since Mr. Buffett is a major shareholder of both Wells Fargo and Goldman Sachs) want us to believe that, with "green shoots" popping up out of the economic soil left and right, record or new record earnings out of at least these 2 banks for the first quarter, and the hope that the government will permit Goldman Sachs to repay the TARP (looming stress tests notwithstanding), the private sector should once again purchase common stock in financial services firms in size.
Highly Choreographed Is Right
Please read Minyan Peter's post in entirety. His insights are always worth a complete look.
To his thoughts I would like to add "highly choreographed" is a huge understatement. Is there anyone who did not think Goldman would "beat the street"?
Even still, no one knows how these things will play out. Those who think they do are just fantasizing. I prefer to wait and see.
What we now know is Goldman beat by a mile. Yes I know it was a sham and so did Barry Ritholtz on the Big Picture Blog as noted in How to Puff Up Earnings, Goldman Sachs Style.
Buy The Sham Or Sell The Sham?
But sham or not, the key question is "Buy The Sham Or Sell The Sham?" because the news itself is irrelevant. The reaction to the news is what is important!
Sell The Sham
For now the market says sell the sham. Moreover, Goldman Sachs is an interesting case study. Please consider the following chart.
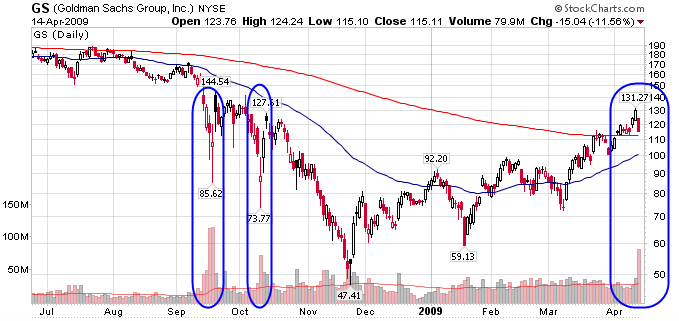
Inquiring minds note that on prior occasions, a volume selloff of Goldman Sachs marked a very temporary short term bottom followed by a massive subsequent selloff. Whether this is a warning shot remains to be seen. However, a more than 100% rally makes it hard to argue against the theory "take the profits and run".
Options Expiry Effect
Options expiration on Friday complicates the read. Rob Roy at Atlantic Advisors posted the following chart in SPY Open Interest and Pin Risk.
SPY Options Expiring Worthless At Each Strike Point
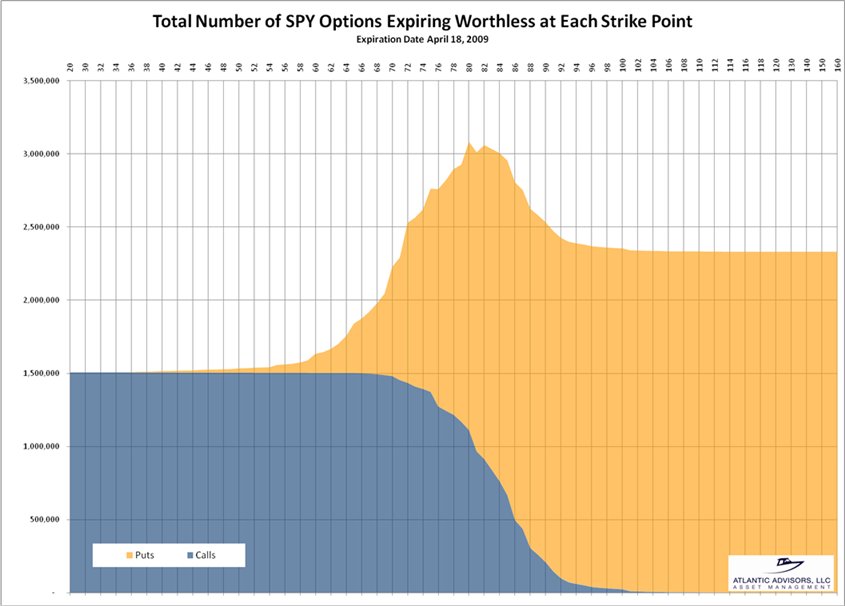
With the SPY closing Friday at $85.81, the greatest number of options would expire worthless if the SPY were to fall to $80 which would be a drop of 6.77% this week. Nearly as damaging to option holders overall would be a fall to $82 which is only a drop of 4.44%. With 5 days of trading, this is all quite possible.
GS Maximum Pain
Call option soared ahead of the widely expected blowout as the following chart shows.
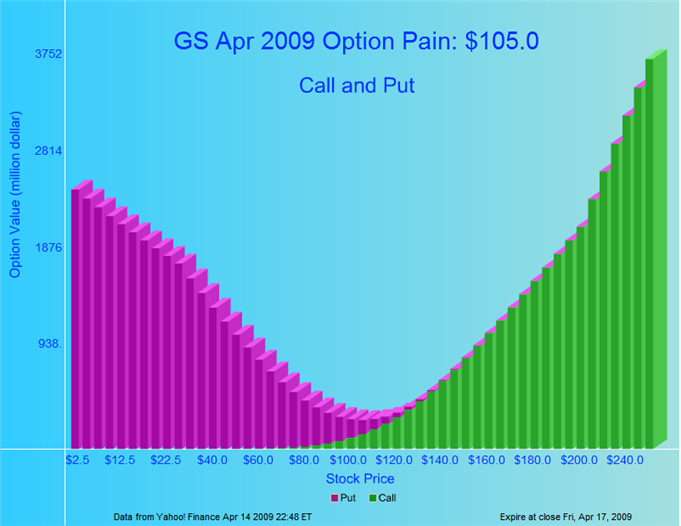
The above chart is courtesy of Option Pain as of 2009-04-14.
$105 is a ways away from Monday's close near $115 but it is certainly a lot closer than $130 or wildly optimistic CALL bet at $150.
Actual Data
Here is a chart of the actual PUT CALL Data from CBOE
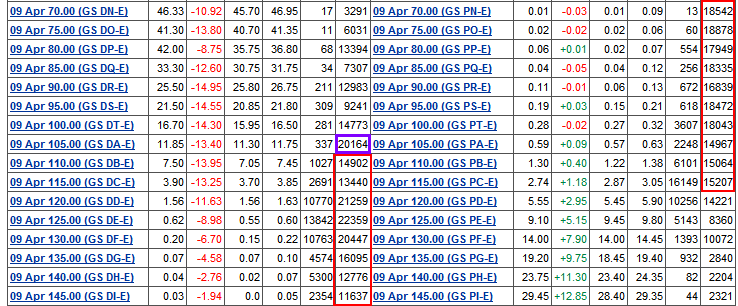
One of the advantages of looking at the hard data is you can ignore outliers of exceptionally high data at various points. Max Pain may be at $105 but my eye gravitated towards the $115 area where Goldman sits right now.
Question of the Day
The question is: "Is this weakness an option expiration thing or not?"
While no one knows the answer, the context is not pretty for many reasons. Here is one key indicator.
Where We Stand
Every day Kevin Depew posts "Where We Stand".
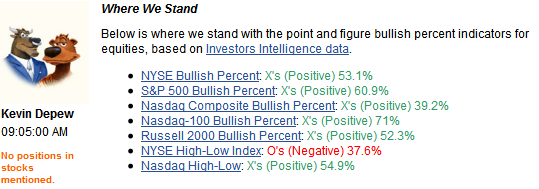
Where We Stand (WWS) is not a timing indicator (nor is it intended to be). Yet every bear market rally has ended with all (or all but 1) of the above indicators green. Likewise, every bear market rally started with every one of the above indicators solidly in the red. A nice turning point can often be found simply by watching the shift from red to green and vice versa in the above table.
WWS is not foolproof (no indicator is) so do not bet your life on it. Nonetheless, history (so far) suggests that once a turn is made, the turn keeps going until it is switches from nearly all one color to nearly all another color. By the way, I am not personally endorsing WWS to any formal degree. I am merely noting what I have noticed about it.
What I See
I see pretty rampant optimism in equity options, general belief that we have turned the economic corner (I highly doubt we have), technically overbought indicators, euphoria on CNBC, and a selloff for whatever reason on supposedly good news. While the market could continue to rally, this is certainly not a good mix.
By Mike "Mish" Shedlock
http://globaleconomicanalysis.blogspot.com
Click Here To Scroll Thru My Recent Post List
Mike Shedlock / Mish is a registered investment advisor representative for SitkaPacific Capital Management . Sitka Pacific is an asset management firm whose goal is strong performance and low volatility, regardless of market direction.
Visit Sitka Pacific's Account Management Page to learn more about wealth management and capital preservation strategies of Sitka Pacific.
I do weekly podcasts every Thursday on HoweStreet and a brief 7 minute segment on Saturday on CKNW AM 980 in Vancouver.
When not writing about stocks or the economy I spends a great deal of time on photography and in the garden. I have over 80 magazine and book cover credits. Some of my Wisconsin and gardening images can be seen at MichaelShedlock.com .
© 2009 Mike Shedlock, All Rights Reserved
Mike Shedlock Archive |
© 2005-2022 http://www.MarketOracle.co.uk - The Market Oracle is a FREE Daily Financial Markets Analysis & Forecasting online publication.


