


Stock Market Rebound Closely Linked with Economic Data Surprises
Stock-Markets / Stocks Bear Market Apr 14, 2009 - 12:51 AM GMTBy: John_Mauldin

 This week we will look at two shorter essays for this edition of Outside the Box. The first is some thoughtful words by Tom Au on whether or not we have put in a true bottom for the market. I particularly want you to read his thoughts on what earnings will look like going forward, and whether we can get back to the highs in corporate earnings we saw in 2006.
In last Friday's letter I mentioned an article by William Hester, CFA, who is the Senior Financial Analyst at the Hussman Funds. (www.hussmanfunds.com) While I quoted a few paragraphs from his essay, on reflection I think I will re-produce it below, as this is a very important concept. I have written in past letters and in Bull's Eye Investing about how powerful a driver earnings surprises can be (both positive and negative). Powerful bear and bull markets develop when there are numerous surprises in the same direction, re-enforcing market psychology.
So, read Hester's essay with the knowledge of what Au writes about earnings. I think the two make a very powerful, thought-provoking concept. And I am off to Europe.
John Mauldin, Editor
Outside the Box
A Stock Market Rebound Closely Linked with Economic Data Surprises
by William Hester, CFA - April, 2009
There are several ways to interpret the economic data in March, most of which came in above what economists were expecting. Some analysts concluded that the worst is over for the economy, and a rebound is ahead. Others suggested that the economy is still contracting, but at a slower rate for now. In any case, economists have overestimated the economy's rate of contraction lately. The rebound in the stock market has been at least partially fueled by economic data that consistently came in better than expected last month. Some part of this rally is likely relying on the continuation of these "positive" surprises.
To track the trends in economic performance, we keep an ongoing tally of how data is announced relative to expectations - a method of analysis originally inspired by Bridgewater Advisors. Economic data that surpasses expectations gets added to a 3-month running total. Data that comes in weaker than expected gets subtracted. A rising line means that economic data is generally coming in above expectations, while a falling line means that the data has disappointed. A descending line could be the result of an economy that is not expanding as quickly as economists predict or - like in 2008 - it could be the result of an economy that is contracting at a faster rate than expected. In the first graph, and the others below, I've isolated only the data that measures the growth in the economy, leaving out measures that track the rate of inflation and sentiment. The first chart below shows the surprise line for growth-related economic data since last August, just prior to the passing of the Emergency Economic Stabilization Act, from which the first version of the TARP was born.
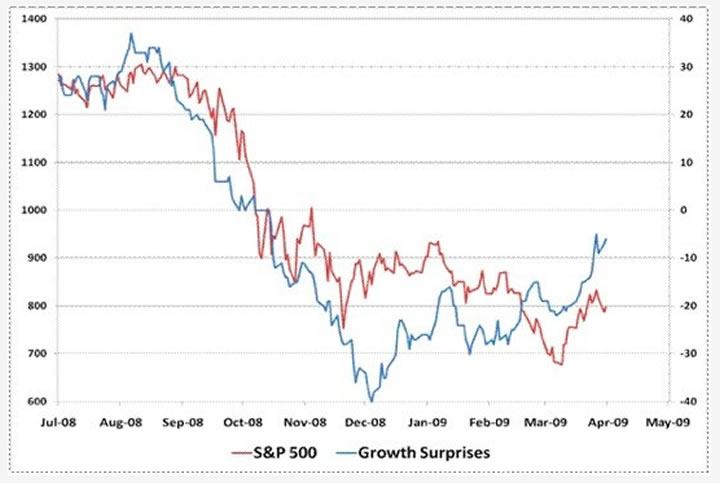
There's nothing quite like pointing out how bad a shape the economy is in to get people acting like the economy is in bad shape. During the early part of last summer the economy was actually holding up better then what was generally expected. But during the final quarter of last year, the economic surprise line (in blue) collapsed. Data persistently came in below expectations, which created the steepest drop in the line tracking economic performance versus expectations in the available data.
The red line in the graph above tracks the S&P 500 Index and it shows that stocks have recently closely tracked the trend in data surprises. The market fell along with the deteriorating surprise line last year, rallied slightly prior to improved news in December, and then rolled over again as the news weakened versus expectations in late January. In March the market rebounded along with a more pronounced persistence in favorable economic news versus expectations.
The data released in March was better (or less negative) than expected on a number of fronts. The slowdown in spending eased, there was temporary relief in the new and existing homes sales data, and sentiment measures mostly halted their steep decent of recent months. But while much of the data was surprising relative to expectations, it's difficult to point to any piece of data that was surprisingly strong (outside of some of the volatile data series like, for example, durable goods). New homes sold at an annual rate of 337 thousand versus 300 thousand (and a peak of 1.4 million). GDP was revised to -6.3 percent versus an estimate of -6.6 percent.
Much of the excitement in the stock market - at least that is related to the current performance of the economy - seems to be centered on an economy that is performing less badly than expected. The risks here seem to be that if the trends in data surprises change, so could investor's attitudes toward stocks that are currently overbought on a number of measures.
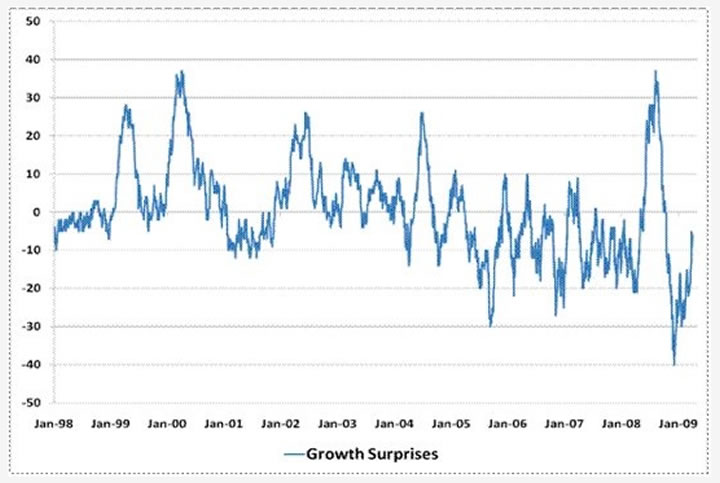
There are a couple of reasons why the trend in the rate of data surprises could change. The first is that trends in economic surprises are very prone to reversals. The chart below shows a longer-term picture of the changes in the trends in economic data surprises. The one thing that stands out looking at the graph is that the trends in surprises often reverse abruptly. When the estimates of economists fall behind in an expanding economy - underestimating its strength - expectations are adjusted upward. These estimates eventually become too optimistic. The same can be said of an economy that is contracting more quickly than expected. And the data shows that the more pronounced their forecast errors - the more abruptly economists begin to overestimate the economy's recent trend.
Another reason why the economic news may begin to disappoint at some point is that recoveries rarely proceed smoothly. The trends in month-to-month and quarter-to-quarter data tend to lurch forward and backward as the economy regains its footing (and at times, like in 1982, the economy can fall right back into recession).
One recent example of this was in 2002, which is shown in the graph below. The trends in economic data versus expectations were persistently better than expected from late 2001 as the economy emerged from recession that year through late spring of 2002. The S&P 500 surged by more than 20% from its 2001 low as the economy began to regain its footing and offer up positive data surprises. But by the summer of 2002 the rebound proved not robust enough when compared with economist's expectations, and the surprise line rolled over. With stocks not yet at valuation levels that were attractive to investors, the S&P plunged along with the data surprise line.
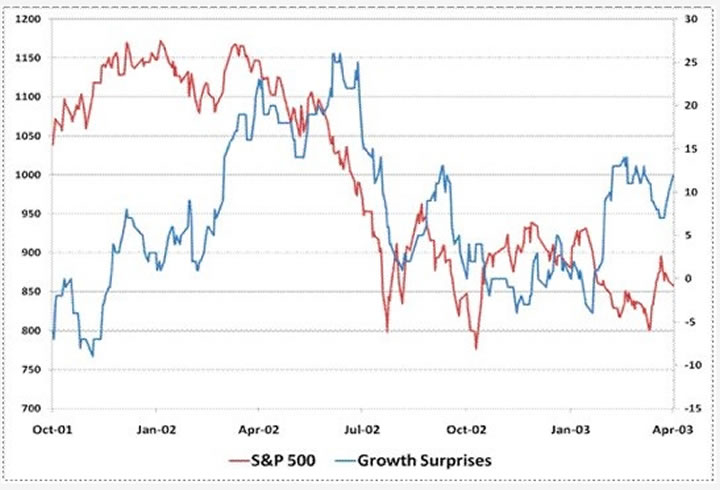
It's important to note that this was during a period where the economy was, in hindsight, no longer in recession, and where there were many measures that showed the economy was growing again. But the market was still tripped up at least partly because expectations had moved ahead of the economic recovery. The bear market remained unfinished, and stocks fell to new lows. This may turn out to be an important risk over the next couple of months. The economic data is certain to be uneven, which in turn may cause investors to begin to question whether an economic recovery is really at hand. Risks will likely be higher at points where the market is overbought.
Investors tend to punish economic disappointments much more strongly during bear markets than during bull markets. The graph below, which shows the S&P 500 and the surprise line from 1998 to 2002, highlights this tendency.
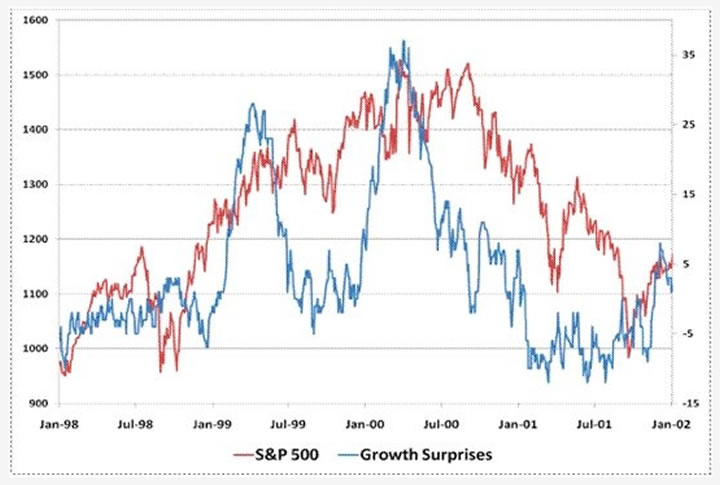
Although it's just a portion of one cycle - the late stages of an expansion and a mild recession, it's worth noting how stocks performed in response to economic data surprises. In the last part of the 1990's bull market, a rising economic data surprise line mostly fueled rallies. Data worse than expected weighed on performance - often causing shallow declines like in 1998 and late 1999. Conversely, during the 2000-2002 bear market, disappointing economic data coincided with steep declines in equity prices, while positive surprises usually eased the market's deterioration.
These trends were also evident during the market's advance from 2003 through 2007, but were somewhat less dependable. During that period, the trends in the surprise data were shorter and more variable than the market's slow, persistent advance. Since last summer, the correlation between the two has tightened considerably. In fact, the correlation between the S&P 500 and the data surprise line has climbed above .80, implying that investors are keeping a close eye on how data comes in relative to expectations.
If the high correlation between stock prices and data surprises holds, the recent rally in stocks might be tested. Even if the economy has bottomed, it's very likely that the eventual recovery will prove to be uneven, causing the flow of positive surprises to be uneven. During these periods, the risks to stocks will be greatest when the market is overbought and investors have priced in high expectations of positive data surprises continuing.
By John Mauldin
John Mauldin, Best-Selling author and recognized financial expert, is also editor of the free Thoughts From the Frontline that goes to over 1 million readers each week. For more information on John or his FREE weekly economic letter go to: http://www.frontlinethoughts.com/learnmore
To subscribe to John Mauldin's E-Letter please click here:http://www.frontlinethoughts.com/subscribe.asp
Copyright 2008 John Mauldin. All Rights Reserved
John Mauldin is president of Millennium Wave Advisors, LLC, a registered investment advisor. All material presented herein is believed to be reliable but we cannot attest to its accuracy. Investment recommendations may change and readers are urged to check with their investment counselors before making any investment decisions. Opinions expressed in these reports may change without prior notice. John Mauldin and/or the staff at Millennium Wave Advisors, LLC may or may not have investments in any funds cited above. Mauldin can be reached at 800-829-7273.
Disclaimer PAST RESULTS ARE NOT INDICATIVE OF FUTURE RESULTS. THERE IS RISK OF LOSS AS WELL AS THE OPPORTUNITY FOR GAIN WHEN INVESTING IN MANAGED FUNDS. WHEN CONSIDERING ALTERNATIVE INVESTMENTS, INCLUDING HEDGE FUNDS, YOU SHOULD CONSIDER VARIOUS RISKS INCLUDING THE FACT THAT SOME PRODUCTS: OFTEN ENGAGE IN LEVERAGING AND OTHER SPECULATIVE INVESTMENT PRACTICES THAT MAY INCREASE THE RISK OF INVESTMENT LOSS, CAN BE ILLIQUID, ARE NOT REQUIRED TO PROVIDE PERIODIC PRICING OR VALUATION INFORMATION TO INVESTORS, MAY INVOLVE COMPLEX TAX STRUCTURES AND DELAYS IN DISTRIBUTING IMPORTANT TAX INFORMATION, ARE NOT SUBJECT TO THE SAME REGULATORY REQUIREMENTS AS MUTUAL FUNDS, OFTEN CHARGE HIGH FEES, AND IN MANY CASES THE UNDERLYING INVESTMENTS ARE NOT TRANSPARENT AND ARE KNOWN ONLY TO THE INVESTMENT MANAGER.
John Mauldin Archive |
© 2005-2022 http://www.MarketOracle.co.uk - The Market Oracle is a FREE Daily Financial Markets Analysis & Forecasting online publication.