S&P 500: Rallying Tech Stocks vs. Plummeting Oil Stocks
Stock-Markets / Stock Market 2021 Nov 23, 2021 - 02:37 PM GMTBy: Paul_Rejczak
The S&P 500 index nearly topped its record high on Friday, but it closed lower following an intraday decline. Is this a topping pattern?
For in-depth technical analysis of various stocks and a recap of today's Stock Trading Alert we encourage you to watch today's video.
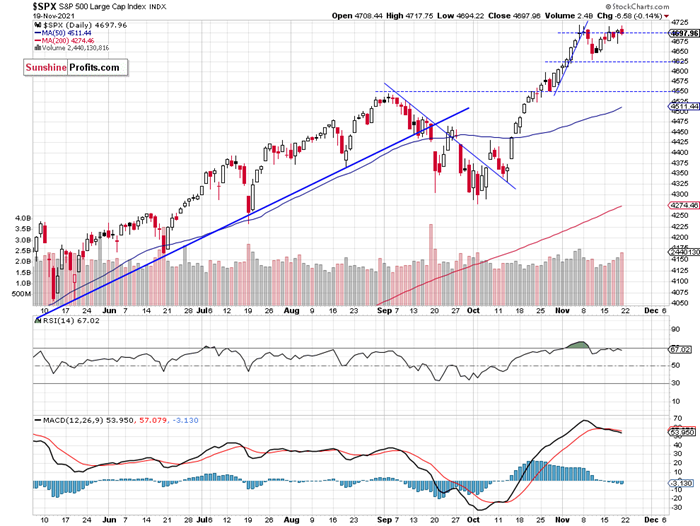
The S&P 500 index lost 0.14% on Friday, Nov. 19, as it extended its short-term consolidation along the 4,700 level. The broad stock market went sideways despite record-breaking rallies in large tech stocks like AAPL, MSFT and NVDA. It still looks like a short-term topping pattern, as the S&P 500 index keeps bouncing from the Nov. 5 record high of 4,718.50.
The nearest important support level remains at 4,630-4,650 and the next support level is at 4,600. On the other hand, the resistance level is at 4,700-4,720. The S&P 500 continues to trade along the 4,700 level, as we can see on the daily chart (chart by courtesy of http://stockcharts.com):

Nasdaq Reached the New Record High
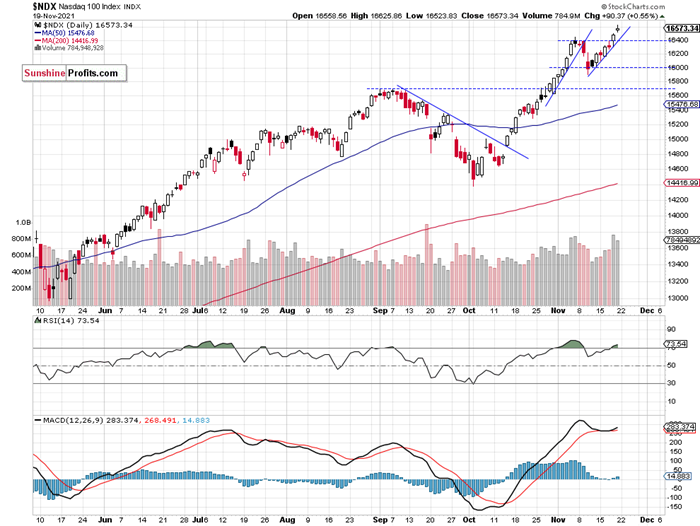
Let’s take a look at the Nasdaq 100 chart. The technology index reached the new record high of 16,625.86 on Friday, led by megacap tech stock rallies. It accelerated above its short-term upward trend line after breaking above the resistance level of 16,400 on Thursday. There have been no confirmed negative signals so far. However, we can see some short-term overbought conditions.

Apple and Microsoft at New Record Highs
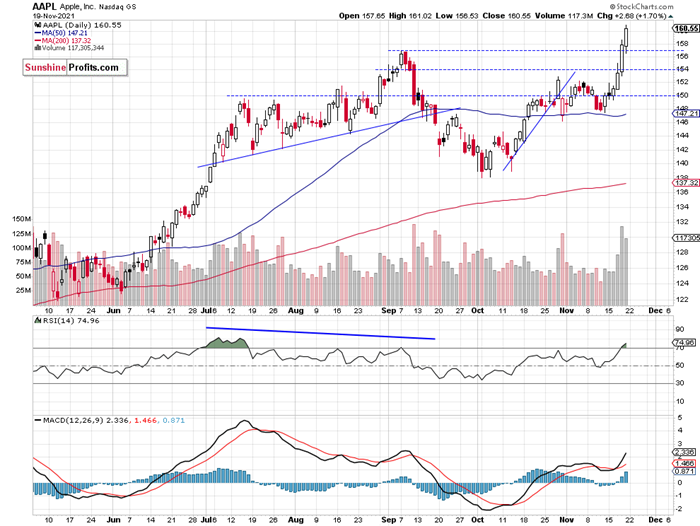
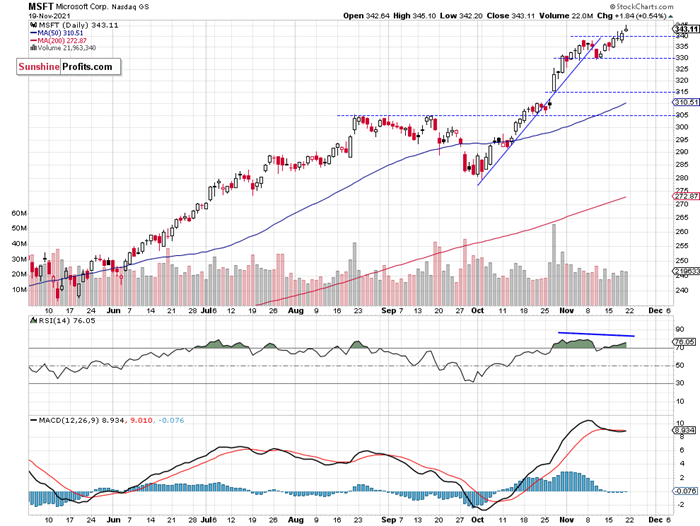
Let’s take a look at the two biggest stocks in the S&P 500 index, AAPL and MSFT. Apple accelerated its uptrend after breaking above the resistance level of around $152-154. It reached the new record high on Friday at $161.02. Microsoft slightly extended its recent advance, as it reached the new record high of $345.10. The two biggest megacap tech stocks reached new record highs, as we can see on their daily charts:


Conclusion
The S&P 500 index is expected to open 0.4% higher this morning. We will likely see some more short-term fluctuations along the record high level. For now, it looks like a short-term consolidation and a flat correction within an uptrend.
Here’s the breakdown:
- The S&P 500 is fluctuating along the 4,700 level. For now, it looks like a short-term consolidation following the October-November rally.
- Still no positions are justified from the risk/reward point of view.
Like what you’ve read? Subscribe for our daily newsletter today, and you'll get 7 days of FREE access to our premium daily Stock Trading Alerts as well as our other Alerts. Sign up for the free newsletter today!
Thank you.
Paul Rejczak,
Stock Trading Strategist
Sunshine Profits: Effective Investments through Diligence and Care
* * * * *
The information above represents analyses and opinions of Paul Rejczak & Sunshine Profits' associates only. As such, it may prove wrong and be subject to change without notice. At the time of writing, we base our opinions and analyses on facts and data sourced from respective essays and their authors. Although formed on top of careful research and reputably accurate sources, Paul Rejczak and his associates cannot guarantee the reported data's accuracy and thoroughness. The opinions published above neither recommend nor offer any securities transaction. Mr. Rejczak is not a Registered Securities Advisor. By reading his reports you fully agree that he will not be held responsible or liable for any decisions you make regarding any information provided in these reports. Investing, trading and speculation in any financial markets may involve high risk of loss. Paul Rejczak, Sunshine Profits' employees, affiliates as well as their family members may have a short or long position in any securities, including those mentioned in any of the reports or essays, and may make additional purchases and/or sales of those securities without notice.
© 2005-2022 http://www.MarketOracle.co.uk - The Market Oracle is a FREE Daily Financial Markets Analysis & Forecasting online publication.


