Dow Stock Market Trend Analysis
Stock-Markets / Stock Market 2021 Nov 11, 2021 - 04:09 PM GMTBy: Nadeem_Walayat
This is part 3 of my extensive analysis that maps out the stock markets trend into Mid 2022 - Stock Market FOMO Hits September Brick Wall - Dow Trend Forecast Sept 2021 to May 2022
Part 1 - Stock Market FOMO Going into Crash Season
Part 2 - Why Most Stocks May Go Nowhere for the Next 10 Years!
Contents:
- Stock Market Forecast 2021 Review
- Stock Market AI mega-trend Big Picture
- US Economy and Stock Market Addicted to Deficit Spending
- US Economy Has Been in an Economic Depression Since 2008
- Inflation and the Crazy Crypto Markets
- Inflation Consequences for the Stock Market
- FED Balance Sheet
- Weakening Stock Market Breadth
- Why Most Stocks May Go Nowhere for the Next 10 Years!
- FANG Stocks
- Margin Debt
- Dow Short-term Trend Analysis
- Dow Annual Percent Change
- Dow Long-term Trend Analysis
- ELLIOTT WAVES Analysis
- Stocks and 10 Year Bond Yields
- SEASONAL ANALYSIS
- Short-term Seasonal Trend
- US Presidential Cycle
- Best Time of Year to Invest in Stocks
- 2021 - 2022 Seasonal Investing Pattern
- Formulating a Stock Market Trend Forecast
- Dow Stock Market Trend Forecast Sept 2021 to May 2022 Conclusion
- Investing fundamentals
- IBM Continuing to Revolutionise Computing
- AI Stocks Portfolio Current State
- My Late October Stocks Buying Plan
- HIGH RISK STOCKS - Invest and Forget!
- Afghanistan The Next Chinese Province, Australia Living on Borrowed Time
- CHINA! CHINA! CHINA!
- Evergrande China's Lehman's Moment
- Aukus Ruckus
The whole of which was first made available to Patrons who support my work. So for immediate first access to ALL of my analysis and trend forecasts then do consider becoming a Patron by supporting my work for just $4 per month. https://www.patreon.com/Nadeem_Walayat.
Whilst my just published analysis updates AI stocks buying levels and zones in the wake of recent earnings reports and the current state of the brewing Financial Crisis 2.0
AI Tech Stocks Portfolio Updated Buying Levels and Zones as Financial Crisis 2.0 Continues Brewing
Contents:
Financial Crisis 2.0 Checklist
The China Syndrome
Stock Market Begins it's Year End Seasonal Santa Rally
Stock Market Trend Forecast Current State
INVESTING LESSON - BUYING VALUE
Peloton 35% CRASH a Lesson of What Happens When One Over Pays for a Loss Making Growth Stock
INVESTING LESSON - Give your Portfolio Some Breathing Space
INVESTING LESSON - Give your Portfolio Some Breathing Space
How Stagflation Effects Stocks
INTEL Bargain - 15.5% Discount Sale
Why Intel stock price dropped 15%?
FACEBOOK - 10% DIscount
IBM - 20% Discount
Amazon - 5% Discount
APPLE 4% Discount
AMD $136 on Route to $200
TSMC - $117
Microsoft $336
Google $2980, PE 28.7, EC 30.
Nvidia Leaves planet Earth - $299, PE of 106
Heads Up on NEW Potential Tech Stocks
AI Stocks Portfolio Updated Buying Levels
AI Stocks Buying Plan B
FREE TRADE the Perfect Stocks and Shares ISA?
FREE SHARE FROM FREETRADE
High Risk Stocks Brief
Crypto's 20% Discount Event
Bitcoin Trend
Palladium Brief
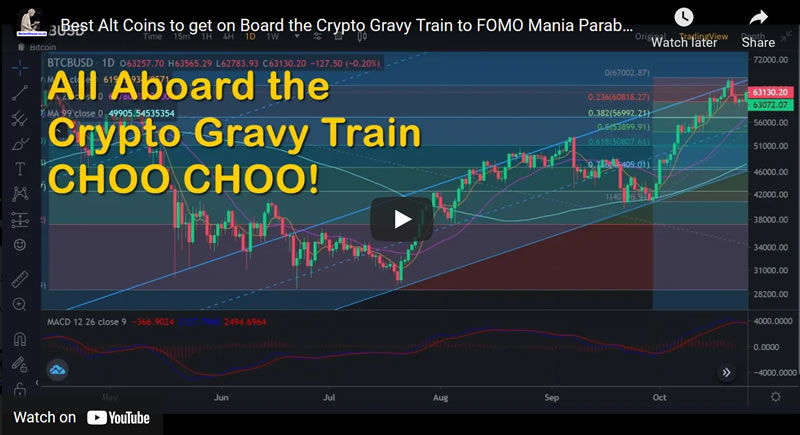
Also gain access to my recent highly timely analysis on why it is time to get onboard the crypto gravy train heading for millennial FOMO 2022 -
Bitcoin NEW All time High is TRIGGER for Future Alt Coins Price Explosion
Contents:
- Bitcoin & Ethereum 2021 Trend
- Crypto Portfolio Current State
- The BITCOIN NEW ALL TIME HIGH Changes EVERYTHING!
- Ravencoin to the MOON!
- What am I doing?
- How to Invest in Crypto's
- Bitcoin 2022 Price Target
- Ethereum 2022 Price Target
- Ravencoin 2022 Price Target
- Cardano (ADA) 2022 Price Target
- Chainlink 2022 Price Target
- Pokadot 2022 Price Target
- Solano 2022 Price Target
- Litecoin 2022 Price Target
- Arweave 2022 Price Target
- Stellar Lumens - XLM 2022 Price Target
- Eth Classic 2022 Price Target
- Vechain 2022 Price Target
- EOS 2022 Price Target
- Earnings Noise Delivers INTEL And IBM Buy Opps
- Facebook and Google Could CRASH 10% Post Earnings Day
- High Risk Stocks Swings and Roundabouts
And here's a sneak peak of in my following video -
For trading crypto's at probably the worlds safest exchange see Coinbase (affiliate links).
For one of the best crypto trading platforms see Binance for 10% discount on trading fees - Discount Code LZ728VLZ
For mining with your GPU check out Nicehash.
As well as access to why inflation will be far from transitory, batten down the hatches for what's to come-
Protect Your Wealth From PERMANENT Transitory Inflation
- Best Real Terms Asset Price Growth Countries for the Next 10 Years
- Worst Real Terms Asset Price Growth Countries for the Next 10 Years
- The INFLATION MEGA-TREND
- Ripples of Deflation on an Ocean of Inflation!
- Stock Market Trend Forecast Current State
- US Dollar - Stocks Correlation
- US Dollar vs Yields vs Dow
- Stock Market Conclusion
- 34th Anniversary of the Greatest Crash in Stock Market History - 1987
- Key Lesson - How to REALLY Trade Markets
- AI Stocks Portfolio Current State
- October Investing Plan
- HIGH RISK STOCKS INVEST AND FORGET PORTFOLIO
- Can US Save Taiwan From China?
And my extensive analysis of Silver concluding in a trend forecast into Mid 2022.
Silver Price Trend Forecast October 2021 to May 2022, CHINOBLE! AI Stocks Buying Plan
- UK Inflation Soaring into the Stratosphere, Real rate Probably 20% Per Annum
- The 2% Inflation SCAM, Millions of Workers take the Red Pill
- Silver Previous Forecast Recap
- Gold Price Trend Implications for Silver
- Silver Supply and Demand
- Silver vs US Dollar
- Gold / Silver Ratio
- SILVER Trend Analysis
- Long-term Trend Analysis
- Formulating a Trend Forecast
- Silver Price Trend Forecast October 2021 to May 2022
- Silver Investing Strategy
- SIL ETF - What About Silver Mining Stocks?
- Gold Price Trend Brief
- Why the CCP is Living on Borrowed Time and Needs a War
- Understanding the Chinese Regime and What it is Capable Of
- Guanxi
- Chinese People do NOT Eat Dogs Newspeak
- CHINOBLE! Evergrande Reality Exposes China Fiction!
- AI Stocks Portfolio Investing Strategy
- AI Stocks Portfolio Amendments
- AI Stocks Portfolio Current State
- October Investing Plan
- HIGH RISK STOCKS INVEST AND FORGET PORTFOLIO
- Why China Could Crash Bitcoin / Crypto's!
- My Next Analysis
So for immediate first access to ALL of my analysis and trend forecasts then do consider becoming a Patron by supporting my work for just $4 per month,https://www.patreon.com/Nadeem_Walayat.
Note: The information provided in this article is solely to enable you to make your own investment decisions and does not constitute a personal investment recommendation or personalised advice.
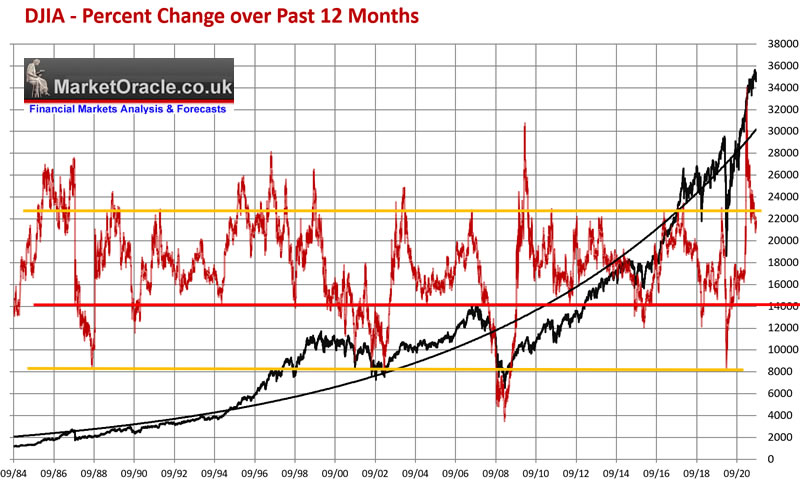
Dow Annual Percent Change
The Dow in percentage terms is well on it's way to retreating from it's most overbought state in decades, what usually tends to happen is that the Dow percent touches or more usually crosses below the red bar and for the bull market to resume would need to cross back above the red bar.How far would the Dow need to fall to fulfill this requirement in the allotted Sept / Oct correction time window? Probably to around 28k. However the alternative is that the Dow stays put around 34k to 35k for the next 6 months, which does not seem probable, so this indicator is suggesting a swift sharp drop to possibly as low as 28k within the next few weeks!
Long-term Trend Analysis
The Dow has barely had any significant correction in now approaching a year, chugging along the upper resistance trend line for the past 6 months.
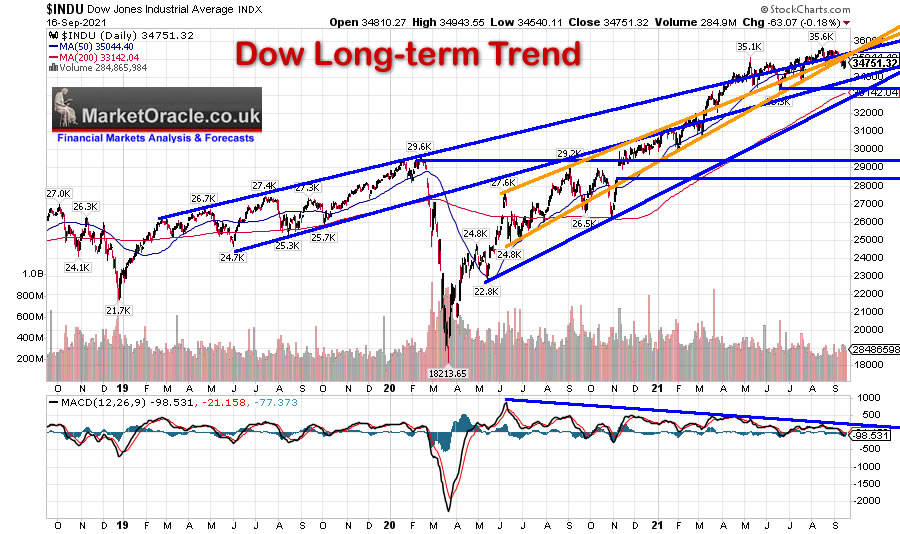
TREND CHANNELS - The Dow fought it's way back into it's tight converging bull market trend channel, all the way towards trading beyond the channel for the past 6 months. The channel extends to 35,500 and 34000 into the end of the year. Whilst the Dow has fallen below the converging post pandemic crash channels thus signaling weakness.
TREND ANALYSIS - The Dow has now made a lower high and low and thus signaled a trend change of sorts right smack at the weakest time of the year. So implies to expect a correction to at least target the May low of $33.3k along which exists significant support. so it's going to be tough for this strong bull market to trade below $33.3k. However below that we have the gap from 28,500 to 29000. Will the Dow fill the gap? It's going to be tough to do given the amount of support. It would take a panic event to do so. At this point at best the Dow appears to be targeting is the string of highs at 31.5k as the probable low.
RESISTANCE - Resistance is along a string of highs just over 35k, to 35.6k.
SUPPORT - There is heavy support at 33k and 31.5k.
TRENDLINES - Apart from the channels there is the support trendline from the first post pandemic low that extends to 33k into Mid Oct, so suggests 33k could be the lowest a correction could carry.
MACD - MACD has been unwinding an overbought state during the rally. So suggests a mild correction to prime the Dow for it's next advance into the end of the year.
ELLIOTT WAVES
Every high is the fifth of the fifth of the fifth! until the market fails to follow through and on we march with the next high then the next high, which is why I take Elliott Wave Theory with a mountain of salt.
My Elliott Wave pattern of Feb 2009 has proven remarkably accurate (as did the pattern before that), see being skeptical works! It's when people think they have found the holy grail when things start to go wrong!
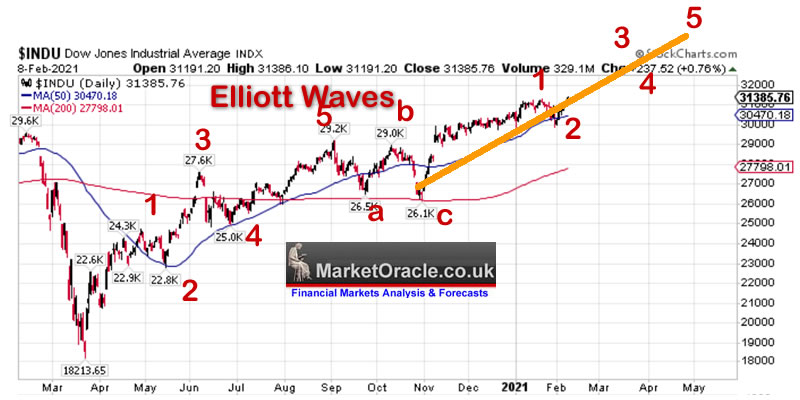
Even the expected ABC off the 5th wave peak in May materialised but was weaker than expected.
So the Wave 5 in MAY was a Wave 3 peak, which implies that we are now in the final wave of a larger move. This suggests NOT to expect a crash in October, rather just a correction as we have still further to run.
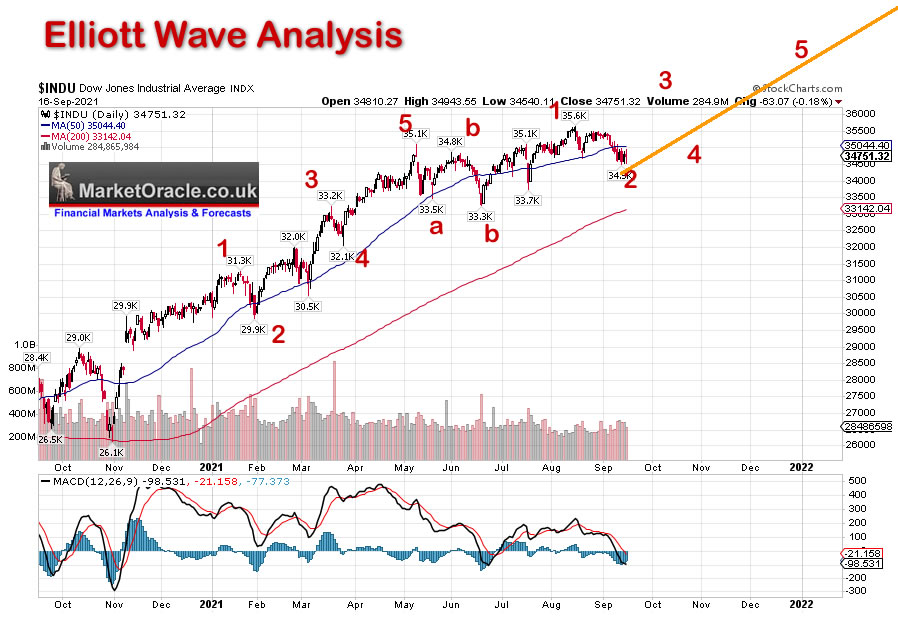
Wave 1 was 5 months, Wave 2 2 months, Wave 3 6 months, Wave 4 about 1.5 months into Mid June, and currently we stand at +3 months into Mid Sept for wave 5 which means we could be in for another 3 months higher and that the October correction will be weak i.e. may not trade below 34k in fact the Dow may even trade to a new high during early October so conflicts with much of my analysis. Also suggests to expect the Dow to trade to a new all time high during late December / Early January, how high? Could be as high as $40k!
Stocks and 10 Year Bond Yields
The basic pattern is for falling yields to be bearish for stocks whilst rising yields are bullish for stocks. The reason being is that investors are selling bonds to buy stocks hence yields and stocks rise.
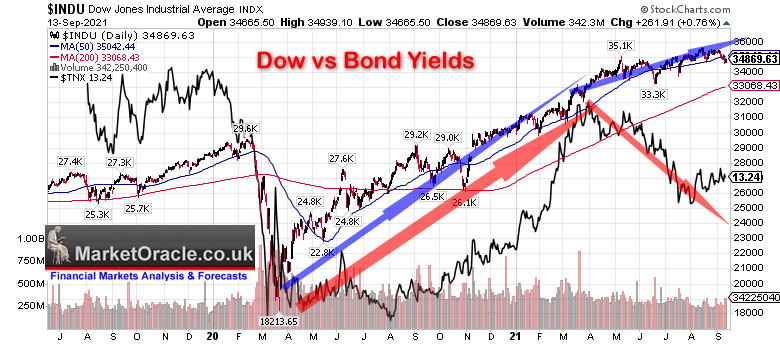
The chart shows this pattern play out up until May 2021, where initial pattern conforming to Dow 33.3k soon reversed as stocks launched into a mania phase WITH falling bond yields. However now we have the opposite problem of rising yields and weakening stocks.
What this suggests to me is that recent rise in yields is temporary, and thus despite talk of tapering and run away inflation, yields could be heading lower. Though with yields trading well below inflation we are not living in normal times, i.e. yields 'should' be ABOVE inflation i.e. well ABOVE 5%!
Also that we are pretty close to the limit below which yields cannot go, as illustrates by the period April 2020 to August 2020 i.e. stocks rose with falling yields because 10 year note yields can't get much lower than that.
So falling yields 'should' pull stocks lower to a degree, which would fit the time line for a correction of a 4 - 6 weeks before stocks just shrug their shoulders and continued on higher.
SEASONAL ANALYSIS
The seasonal pattern suggests after a pause in Feb, higher into late April, then correct from early May into late June followed by a volatile summer terminating in a swing low during September that should set the scene for a bull run into the Christmas Holidays with of course intra month volatility during October that tends to resolve to the upside just as the perma-bears are crowing at their loudest that the end is neigh.
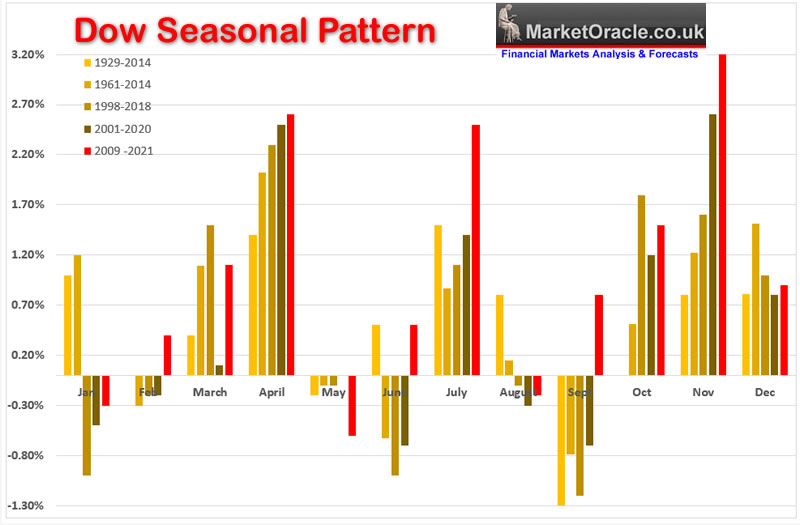
This year we got our strong July and a strong August which was contrary to the bull markets usual pattern. Which means that whilst the bull market has had a tendency to go against it's longer term seasonal trend by moving higher during September, nevertheless the strong August likely sows the seeds for a weak September. Then it's a case of off to the races for a Strong October, even stronger November and more gains in December courtesy of Santa all before a weak January and February.
So the seasonal pattern points to a window of opportunity spanning September and likely into Mid October to allow one to pick up stocks trading at a discount of sorts hence my original plan to buy back stocks after the October low, following which the bull trend is expected to resume into the end of the year. Especially take note of November strengthening over time which looks like the santa rally starting earlier each year as investors attempt to preempt exposure and thus December has been gradually losing it's stock market lustre to November. So one should want to be positioned BEFORE the start of November else be chasing after rising stock prices all month long.
Though note If what we have seen is THE BULL MARKET TOP then well we won't get a Santa rally, what we probably will get is a stock market bouncing around in a trading range repeatedly off or near the October lows. It's going to be an interesting next few months, imagine the shock on market participants if come December stocks aren't trading much off their October lows and perhaps nudging below from time to time.
Short-term Seasonal Trend
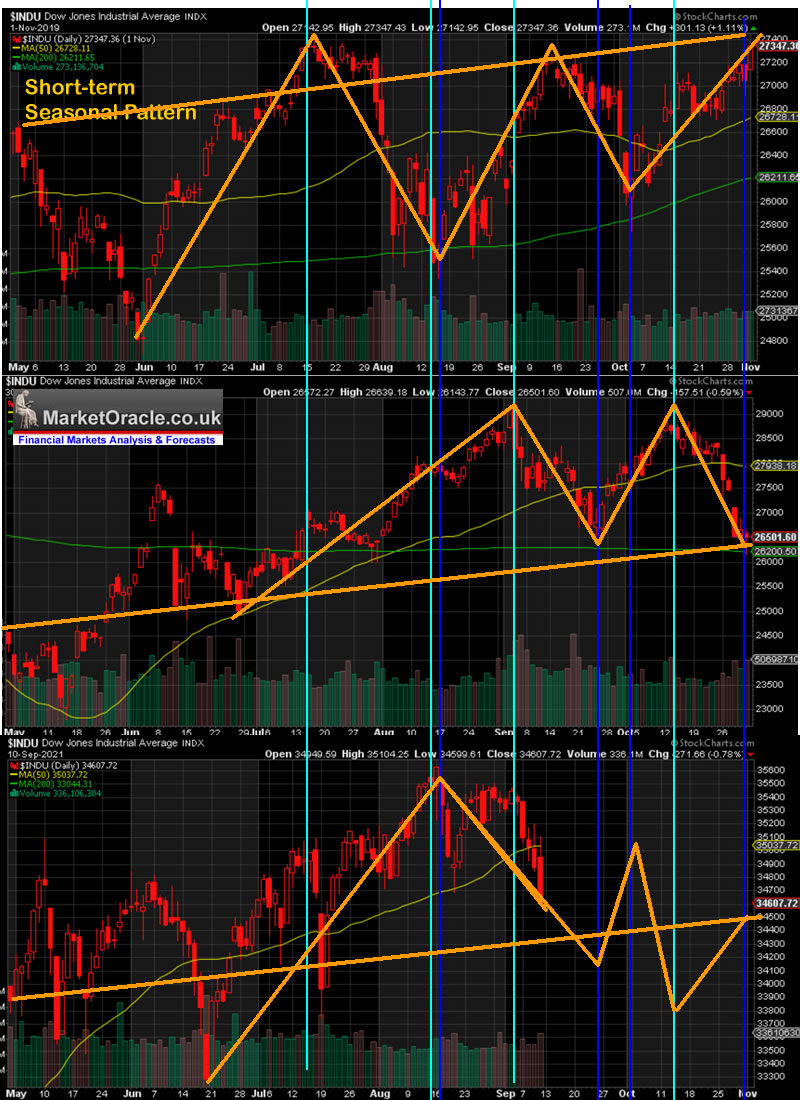
Short-term seasonal pattern for the past 2 years has been fairly robust, i.e. higher lows all the way! This years high going into the correction season came Mid August which therefore means there is not much time left for more downside price action before a counter trend rally, thus stocks should bottom fairly soon for a rally of sorts. Now to achieve a low around Mid October the rally would need to be pretty brief in terms of time. How likely is this pattern to unfold? The early October rally appears to be too brief to seem natural, thus we may get the rally starting earlier and continuing a little later into October which therefore suggests the final sell off continuing deeper into the 2nd half of October, maybe into the end of October so as to spread the trend out into a more natural price pattern.
US Presidential Cycle
Post election years tend to be the weakest of the four years, resulting in an average gain for the year of 3% against an average of 10.6% for the stronger pre election years. However, The stock market tends to be stronger under Democrats than Republicans during the post election years, up 6 out of 7 vs Up 3 out of 10 for republicans and average gain of +13.4% vs +1.5%. So the election year cycle favours a strong up year as Uncle Biden prints plenty of dollars for everyone to party, which is basically what we are experiencing. Though next year that Democrat performance slumps to just +0.6%! Which suggests this rally is a time to take profits and de risk, because 2022 according to the Presidential cycle could be weak!
Back in early Feb I concluded - "therefore suggests 2021 could turn out to be a strongly bullish year with the market trading up by at least 10% towards the end of the year, in fact could surprise to the upside, 15%, 20% even?" So far we are well on our way for a +15% to +20% for 2021 based on this measure alone.
Best Time of Year to Invest in Stocks
Statistically the best time of year to buy Stocks is during late October and then hold all the way through to the end of April, for an early May top, whilst the subsequent 6 months tend to be the weakest of the year. This year the stock market was strong into early May, but so far subsequent weakness has failed to materialise, though we do have a month or so to go. Where the strategy is to buy the market as it rally's off the October lows and then look to hold into late April / Early May 2022.
2021 - 2022 Seasonal Investing Pattern
Pulling all four seasonal patterns together suggests to expect stocks to fall into a late October low, then rally into the end of April to be followed by a significant bear trend during 2022.
Dow Stock Market Trend Forecast Sept 2021 to May 2022 Conclusion
This rest of this extensive analysis - Stock Market FOMO Hits September Brick Wall - Dow Trend Forecast Sept 2021 to May 2022 has first made available to Patrons who support my work. So for immediate first access to ALL of my analysis and trend forecasts then do consider becoming a Patron by supporting my work for just $4 per month. https://www.patreon.com/Nadeem_Walayat.
- Formulating a Stock Market Trend Forecast
- Dow Stock Market Trend Forecast Sept 2021 to May 2022 Conclusion
- Investing fundamentals
- IBM Continuing to Revolutionise Computing
- AI Stocks Portfolio Current State
- My Late October Stocks Buying Plan
- HIGH RISK STOCKS - Invest and Forget!
- Afghanistan The Next Chinese Province, Australia Living on Borrowed Time
- CHINA! CHINA! CHINA!
- Evergrande China's Lehman's Moment
- Aukus Ruckus
My analysis schedule includes:
- AI Stocks Buying levels update, stock market trend forecast current state - Just Posted.
- UK House Prices Trend Analysis, including an update for the US and a quick look at Canada and China - 65% done
- How to Get Rich! - 90% done - This is a good 6 month work in progress nearing completion.
- US Dollar and British Pound analysis
- Gold Price Trend Analysis - 10%
Again for immediate access to all my work do consider becoming a Patron by supporting my work for just $4 per month. https://www.patreon.com/Nadeem_Walayat.
Your battening down the hatches for the coming inflation storm analyst.
Nadeem Walayat
Copyright © 2005-2021 Marketoracle.co.uk (Market Oracle Ltd). All rights reserved.
Nadeem Walayat has over 35 years experience of trading derivatives, portfolio management and analysing the financial markets, including one of few who both anticipated and Beat the 1987 Crash. Nadeem's forward looking analysis focuses on UK inflation, economy, interest rates and housing market. He is the author of five ebook's in the The Inflation Mega-Trend and Stocks Stealth Bull Market series that can be downloaded for Free.
 Nadeem is the Editor of The Market Oracle, a FREE Daily Financial Markets Analysis & Forecasting online publication that presents in-depth analysis from over 1000 experienced analysts on a range of views of the probable direction of the financial markets, thus enabling our readers to arrive at an informed opinion on future market direction. http://www.marketoracle.co.uk
Disclaimer: The above is a matter of opinion provided for general information purposes only and is not intended as investment advice. Information and analysis above are derived from sources and utilising methods believed to be reliable, but we cannot accept responsibility for any trading losses you may incur as a result of this analysis. Individuals should consult with their personal financial advisors before engaging in any trading activities.
Nadeem Walayat Archive |
© 2005-2022 http://www.MarketOracle.co.uk - The Market Oracle is a FREE Daily Financial Markets Analysis & Forecasting online publication.


