AI Tech Stocks Portfolio Current State
Companies / AI Oct 28, 2021 - 11:05 PM GMTBy: Nadeem_Walayat
AI Stocks Buying Pressure Evaluation
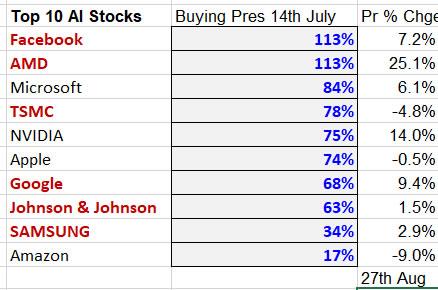
Its now over 6 weeks since I first posted the AI generated forecasts where I deemed the resulting Buying Pressure as being the most important derived indicator for what the stocks are likely to do. For instance Facebook and AMD were expected to be the strongest, and not far behind Microsoft, Apple, Google, where Nvidia strength was contrary to my expectations for this over valued stock. Basically the AI was saying that I had a mistake mistake by selling out of Microsoft, Apple and Nvidia etc. The only decision it was concurring with was that Amazon was expected to be weak with only 17% upwards buying pressure, as was Samsung at 34%. and IBM on 26%. Whilst an unloved Intel continued to carry huge unrealised potential hence my seeking to accumulate more on any dips below $50.

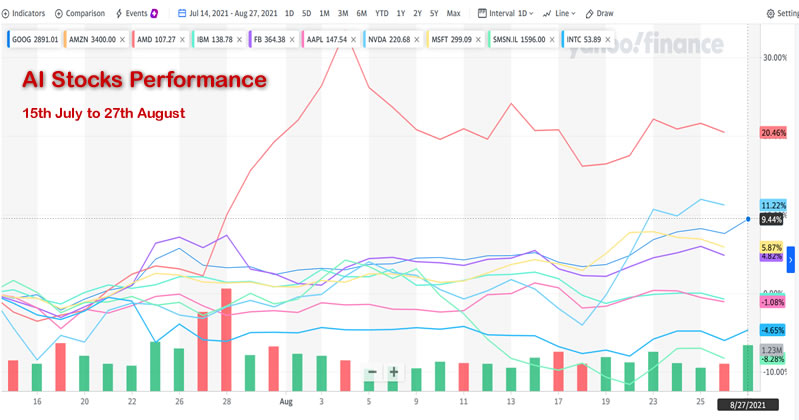
So how has this indicator faired over the subsequent 6 weeks, here are the AI stocks listed in order of buying pressure and their performance since the Mid July run.

The 2 strongest stocks are up 25% and 7.2%, whilst the 2 weakest stocks are Down 9% and Up 2.9%. So the buying pressure even on this short-time frame proved useful in ones decision making process where the higher the buying pressure for primary and secondary stocks then the greater the probability for higher stock prices, whilst Sleepers tend to do their own thing. So the ASVF has passed it's first real world, real time test as one should always be skeptical of black boxes which is basically what neural nets are i.e. I do not know exactly what it's doing in terms of determining it's weights and outputs.
The bottom line is that an indicator can only be taken seriously if it continues to deliver going FORWARD, and not the back testing garbage that many tend to be obsessed with.
AI Stocks Portfolio Current State
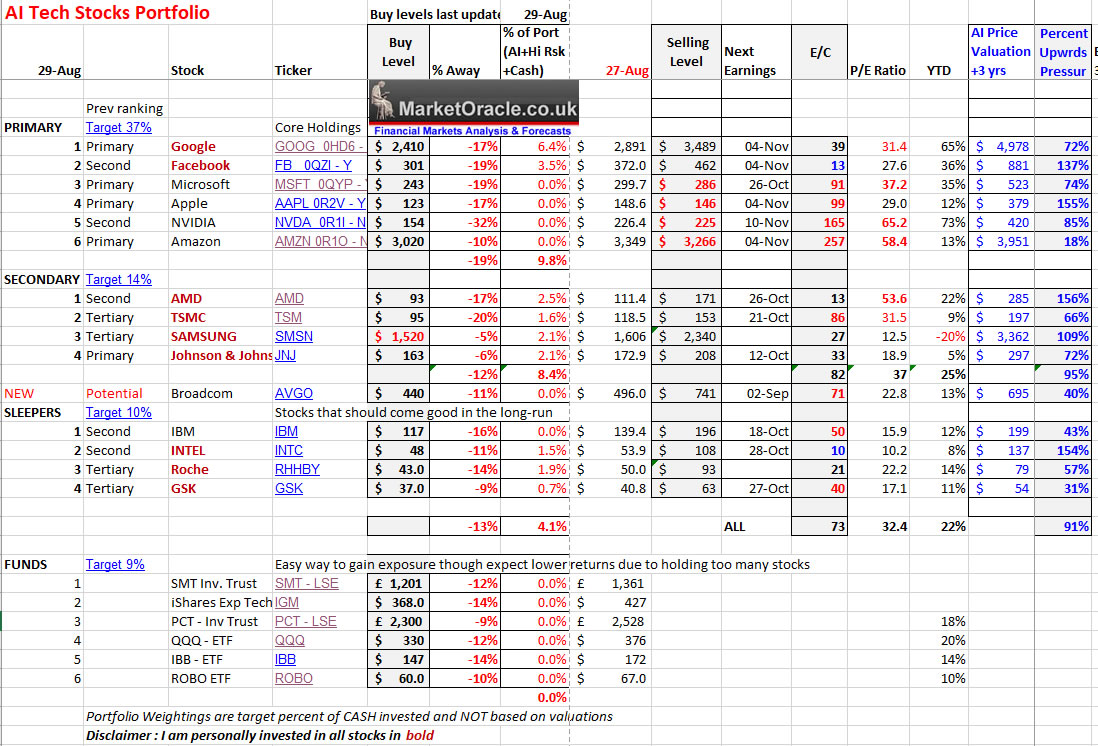
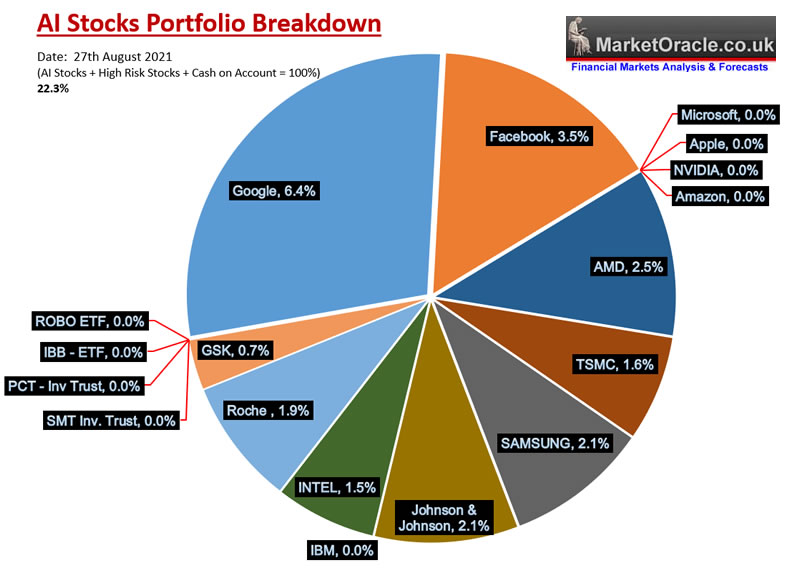
Here's the updated current state of the Portfolio going into September that contains several new metrics as listed in the KEY, followed by a pie chart to further illustrate the current breakdown of my AI stocks holdings.


AI Stocks Portfolio KEY
Stock Name in maroon means I have a position in that stock, conversely a stock in black means I hold no position in that stock
Buying Level - Where I would consider buying, I buy most of the stocks at or very near their 1st Buy level, and some additionally at their 2nd Buy Level when achieved. The only exception so far is WDC since I have had my fill of high risk stocks for the time being.
Port % (AI +Hi Risk+C) - My holding in each stock as a percent of AI stocks + High Risk stocks + Cash on account. So basically my public portfolio. I do hold more that I call legacy stocks, that I have long since forgotten why I bought them decades ago, such as BHP, UU, BP, BAT, Bailie Gifford Japan and so on. Most of which I just let ride with limit orders to sell on a few such as BP.
Selling Level - An earnings derived level that I would consider selling holdings at or beyond due to over valuation, good until next earnings release.
E/C Ratio - A formulae encompassing 15 inputs such as Price to Book, Price to Sales, P/E etc.
P/E Ratio - Price divided by earnings.
Price valuation and Upwards Pressure - What the AI thinks about the future prospects for each stock updated at the time of each earnings report. Where the key metric is the Percent Upwards Pressure which indicates how strong the stock could be relative to others over the coming weeks and months. Whilst for sleepers indicates how good or bad of a buy the stock is relative to others.
What's cheap ?
This article is an excerpt form my recent in-depth analysis : Stock Market FOMO Going into Crash Season, Chinese Stocks and Bitcoin Trend Update
- FOMO Fumes on Negative Earnings
- Cathy Woods ARK Funds Performance Year to Date - Chinese Stocks Big Mistake
- INTEL The Two Steps Forward One Step Back Corporation
- AMD Ryzen 3D
- New Potential Addition to my AI Stocks Portfolio
- Why is Netflix a FAANG Stock?
- Stock Market CRASH / Correction
- How to Protect Your Self From a Stock Market CRASH / Bear Market?
- Chinese Tech Stocks CCP Paranoia
- VIES - Variable Interest Entities
- CCP Paranoid
- Best AI Tech Stocks ETF?
- Best UK Investment Trust
- AI Stocks Buying Pressure Evaluation
- AI Stocks Portfolio Current State
- AI Stocks Portfolio KEY
- What to Buy Today?
- INVEST AND FORGET HIGH RISK STOCKS!
- High Risk Stocks KEY
- Bitcoin Trend Forecast Current State
- Crypto Bear Market Accumulation Current State
- Crazy Crypto Exchanges - How to Buy Bitcoin for $42k, Sell for $59k when trading at $47k!
The whole of this extensive analysis was first made available to Patrons who support my work. So for immediate first access to ALL of my analysis and trend forecasts then do consider becoming a Patron by supporting my work for just $4 per month . https://www.patreon.com/Nadeem_Walayat.
Including access to my most recent in-depth analysis - Silver Price Trend Forecast October 2021 to May 2022, CHINOBLE! AI Stocks Buying Plan
- UK Inflation Soaring into the Stratosphere, Real rate Probably 20% Per Annum
- The 2% Inflation SCAM, Millions of Workers take the Red Pill
- Silver Previous Forecast Recap
- Gold Price Trend Implications for Silver
- Silver Supply and Demand
- Silver vs US Dollar
- Gold / Silver Ratio
- SILVER Trend Analysis
- Long-term Trend Analysis
- Formulating a Trend Forecast
- Silver Price Trend Forecast October 2021 to May 2022
- Silver Investing Strategy
- SIL ETF - What About Silver Mining Stocks?
- Gold Price Trend Brief
- Why the CCP is Living on Borrowed Time and Needs a War
- Understanding the Chinese Regime and What it is Capable Of
- Guanxi
- Chinese People do NOT Eat Dogs Newspeak
- CHINOBLE! Evergrande Reality Exposes China Fiction!
- AI Stocks Portfolio Investing Strategy
- AI Stocks Portfolio Amendments
- AI Stocks Portfolio Current State
- October Investing Plan
- HIGH RISK STOCKS INVEST AND FORGET PORTFOLIO
- Why China Could Crash Bitcoin / Crypto's!
- My Next Analysis
Also my recent latest extensive analysis on the prospects for the stock market into Mid 2021 see - Stock Market FOMO Hits September Brick Wall - Dow Trend Forecast Sept 2021 to May 2022
Contents:
- Stock Market Forecast 2021 Review
- Stock Market AI mega-trend Big Picture
- US Economy and Stock Market Addicted to Deficit Spending
- US Economy Has Been in an Economic Depression Since 2008
- Inflation and the Crazy Crypto Markets
- Inflation Consequences for the Stock Market
- FED Balance Sheet
- Weakening Stock Market Breadth
- Why Most Stocks May Go Nowhere for the Next 10 Years!
- FANG Stocks
- Margin Debt
- Dow Short-term Trend Analysis
- Dow Annual Percent Change
- Dow Long-term Trend Analysis
- ELLIOTT WAVES Analysis
- Stocks and 10 Year Bond Yields
- SEASONAL ANALYSIS
- Short-term Seasonal Trend
- US Presidential Cycle
- Best Time of Year to Invest in Stocks
- 2021 - 2022 Seasonal Investing Pattern
- Formulating a Stock Market Trend Forecast
- Dow Stock Market Trend Forecast Sept 2021 to May 2022 Conclusion
- Investing fundamentals
- IBM Continuing to Revolutionise Computing
- AI Stocks Portfolio Current State
- My Late October Stocks Buying Plan
- HIGH RISK STOCKS - Invest and Forget!
- Afghanistan The Next Chinese Province, Australia Living on Borrowed Time
- CHINA! CHINA! CHINA!
- Evergrande China's Lehman's Moment
- Aukus Ruckus
So for immediate first access to ALL of my analysis and trend forecasts then do consider becoming a Patron by supporting my work for just $3 per month. https://www.patreon.com/Nadeem_Walayat.
My analysis schedule includes:
- UK House Prices Trend Analysis, including an update for the US and a quick look at Canada and China - 30% done
- How to Get Rich! - 90% done - This is a good 6 month work in progress nearing completion.
- US Dollar and British Pound analysis
- Gold Price Trend Analysis - 10%
Again for immediate access to all my work do consider becoming a Patron by supporting my work for just $4 per month https://www.patreon.com/Nadeem_Walayat.
And ensure you are subscribed to my ALWAYS FREE newsletter for my next in-depth analysis.
Your AI data preprocessing analyst.
Nadeem Walayat
Copyright © 2005-2021 Marketoracle.co.uk (Market Oracle Ltd). All rights reserved.
Nadeem Walayat has over 35 years experience of trading derivatives, portfolio management and analysing the financial markets, including one of few who both anticipated and Beat the 1987 Crash. Nadeem's forward looking analysis focuses on UK inflation, economy, interest rates and housing market. He is the author of five ebook's in the The Inflation Mega-Trend and Stocks Stealth Bull Market series that can be downloaded for Free.
 Nadeem is the Editor of The Market Oracle, a FREE Daily Financial Markets Analysis & Forecasting online publication that presents in-depth analysis from over 1000 experienced analysts on a range of views of the probable direction of the financial markets, thus enabling our readers to arrive at an informed opinion on future market direction. http://www.marketoracle.co.uk
Disclaimer: The above is a matter of opinion provided for general information purposes only and is not intended as investment advice. Information and analysis above are derived from sources and utilising methods believed to be reliable, but we cannot accept responsibility for any trading losses you may incur as a result of this analysis. Individuals should consult with their personal financial advisors before engaging in any trading activities.
Nadeem Walayat Archive |
© 2005-2022 http://www.MarketOracle.co.uk - The Market Oracle is a FREE Daily Financial Markets Analysis & Forecasting online publication.


