


Are The US Major Stock Market Indexes Rolling Over In An Excess Phase Peak Setup?
Stock-Markets / Stock Market 2021 Jun 25, 2021 - 06:52 PM GMTBy: Chris_Vermeulen

Recently, I published a research article on Bitcoin suggesting there may be a bigger downside price move setting up – breaking support near $30k and extending the Excess Phase Peak pattern that we warned about back in November 2020. Today, my team and I wanted to alert you that the recent price rotation in the Dow Jones Industrial Average and the Transportation Index COULD setup in an early stage (Phase #2) peaking formation similar to what started the recent down trend in Bitcoin.
The setup of the Excess Phase peak pattern consists of an exuberant rally to a peak (Phase #1), followed by a moderate price correction that sets up into a sideways flagging pattern (Phase #2). If the INDU and TRAN continue to move in a sideways flagging formation after recently move moderately lower, we may start to see a new Excess Phase Peak setup in these two major indexes. This could be a warning of a much bigger breakdown in trend in the near future.
Please take a minute to review our earlier research posts related to the Excess Phase Peak setup (below) and how it related to the current market trend:
- November 25, 2020: HOW TO SPOT THE END OF AN EXCESS PHASE – PART I
- November 27, 2020: HOW TO SPOT THE END OF AN EXCESS PHASE – PART II
- May 20, 2021: BITCOIN COMPLETES PHASE #3 OF EXCESS PHASE TOP PATTERN – WHAT NEXT?
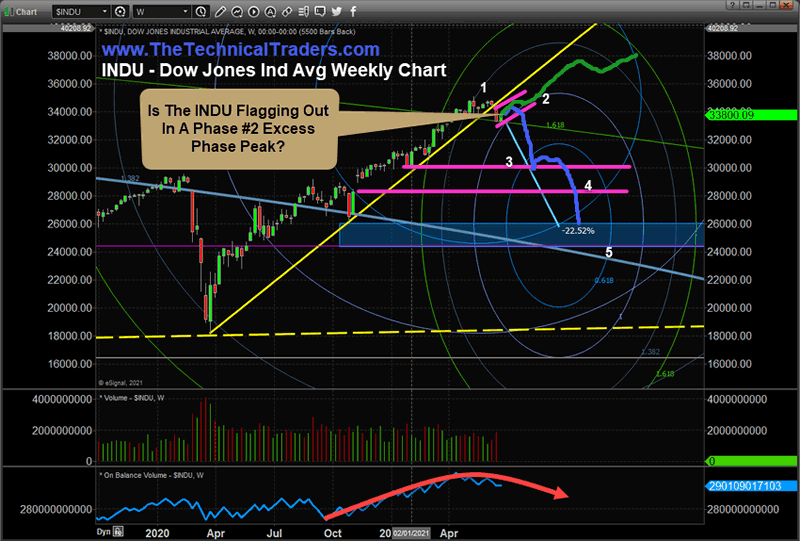
INDU Must Rally Above $35,300 To Break Away From Excess Phase Peak
The Weekly INDU chart, below, highlights the five phases of the Excess Phase Peak formation and also highlights a GREEN “break-away” rally trend that could setup to end any potential Excess Phase Peak formation. If the markets resume the rally trend and the INDU rallies above $35,300 soon, we would consider this a new “break-away” rally trend – potentially ending the Excess Phase Peak pattern setup. If the INDU fails to rally above $35,300 and trades within the Phase #2 sideways flag range, then breaks downward, this type of price action would confirm the Phase #3 breakdown price trend that sets up intermediate support and the eventual Phase #4 sideways consolidation.
Remember, the phases of the Excess Phase Peak pattern are fairly easy to identify.
- Phase #1: The rally to the ultimate peak level.
- Phase #2: The breakdown of that peak level, setting up the initial support level and prompting a sideways price Flag/Pennant price channel.
- Phase #3: The breakdown of the #2 sideways price channel leading to a steep decline to intermediate support – which acts as a temporary sideways bottom.
- Phase #4: The breakdown of the intermediate support level which ultimately leads to the strongest price decline targeting the ultimate bottom in price.
- Phase #5: Identifying the ultimate bottom/momentum base in price. This trending phase can last many months (possibly more than 12 months at time), or could be in the form of a deep “V” bottom.
Once the breakdown of the Phase #2 flagging formation is confirmed, we start to look for confirmation of the Phase #3 intermediate support level and the eventual Phase #4 breakdown of that support level.
Be sure to sign up for our free market trend analysis and signals now so you don’t miss our next special report!
If the INDU rallies above the recent all-time highs and breaks-away from the sideways flag ranges, then we would consider that new high as a new bullish price trend – negating the Excess Phase Peak Phase #2 setup completely. Obviously, any new all-time high/rally could eventually setup another Phase #1 peak and Phase #2 sideways flagging channel at any time in the future.
Near the lower area of this chart we’ve highlighted the On Balance Volume trend and how it has recently started to trend lower. We would expect any continued upside price trending to support an increasing OBV level as accumulation takes place in the markets. Failure to see the OBV level rising as price rises may suggest a “false break-away” in trend.
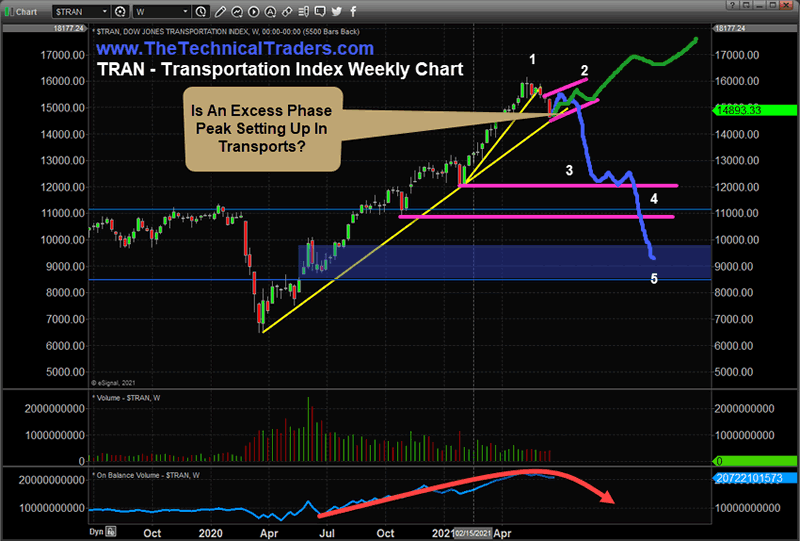
TRAN Mirroring Excess Phase Peak Flagging Setup – What Next?
This Weekly Transportation Index chart should appear very similar to the INDU chart (above). The unique similarities of these two charts, one addressing the Blue Chip US economy and the other addressing future US transportation expectations related to economic activity, suggests traders may be shifting away from a reflation recovery after the FOMC statements last week. We are starting to see traders/investors reevaluate the capability of the US economy to continue the rally trends as they have since November 2020. Could this shift in investor sentiment prompt a broader market price setup? Is it warning of an Excess Phase Peak setup in the making?
Right now, we only have confirmation of a recent all-time high peak and the start of what appears to be a sideways Flagging price channel. We won’t know if the Excess Phase Peak pattern is truly confirmed until we see how the current sideways Flagging price channel concludes.
If it breaks downward, then we’ll have confirmation of a Phase #3 Excess Phase Peak stage that will alert us that a bigger downside price trend is pending. If it breaks higher, and takes out $16,175, then we’ll consider this new rally high an end of the current Phase #2 setup and expect prices to continue rallying to new highs.
As we move into the end of June, the end of Q2:2021, it is important to understand that market price volatility should begin to increase as earnings and forward expectations continue to flood the news wires. We are only 8+ days away from the end of June and we believe the markets are likely to trend sideways through to the end of the month – leading up to the Q2:2021 earnings calendar.
It makes sense to us that the broader markets, and investors, are searching for more clarity and reason to be bullish after such an extended price rally. Time will tell how this plays out, but one thing is certain: Q2:2021 earnings and forward expectations will likely drive trader/investor sentiment over the next 3+ weeks. Expect an increase in volatility and some potential surprises.
Consider this message an early warning if the Excess Phase Peak setup continues and confirms the Phase #3 breakdown of the current sideways Flagging setup.
Want to know how our BAN strategy is identifying and ranking various sectors and ETFs for the best possible opportunities for future profits? Please take a minute to learn about my BAN Trader Pro newsletter service and how it can help you identify and trade better sector setups. My team and I have built this strategy to help us identify the strongest and best trade setups in any market sector. Every day, we deliver these setups to our subscribers along with the BAN Trader Pro system trades. You owe it to yourself to see how simple it is to trade 30% to 40% of the time to generate incredible results.
Have a great day!
Chris Vermeulen
www.TheTechnicalTraders.com
Chris Vermeulen has been involved in the markets since 1997 and is the founder of Technical Traders Ltd. He is an internationally recognized technical analyst, trader, and is the author of the book: 7 Steps to Win With Logic
Through years of research, trading and helping individual traders around the world. He learned that many traders have great trading ideas, but they lack one thing, they struggle to execute trades in a systematic way for consistent results. Chris helps educate traders with a three-hour video course that can change your trading results for the better.
His mission is to help his clients boost their trading performance while reducing market exposure and portfolio volatility.
He is a regular speaker on HoweStreet.com, and the FinancialSurvivorNetwork radio shows. Chris was also featured on the cover of AmalgaTrader Magazine, and contributes articles to several leading financial hubs like MarketOracle.co.uk
Disclaimer: Nothing in this report should be construed as a solicitation to buy or sell any securities mentioned. Technical Traders Ltd., its owners and the author of this report are not registered broker-dealers or financial advisors. Before investing in any securities, you should consult with your financial advisor and a registered broker-dealer. Never make an investment based solely on what you read in an online or printed report, including this report, especially if the investment involves a small, thinly-traded company that isn’t well known. Technical Traders Ltd. and the author of this report has been paid by Cardiff Energy Corp. In addition, the author owns shares of Cardiff Energy Corp. and would also benefit from volume and price appreciation of its stock. The information provided here within should not be construed as a financial analysis but rather as an advertisement. The author’s views and opinions regarding the companies featured in reports are his own views and are based on information that he has researched independently and has received, which the author assumes to be reliable. Technical Traders Ltd. and the author of this report do not guarantee the accuracy, completeness, or usefulness of any content of this report, nor its fitness for any particular purpose. Lastly, the author does not guarantee that any of the companies mentioned in the reports will perform as expected, and any comparisons made to other companies may not be valid or come into effect.
Chris Vermeulen Archive |
© 2005-2022 http://www.MarketOracle.co.uk - The Market Oracle is a FREE Daily Financial Markets Analysis & Forecasting online publication.