Real US Interest Rates and Gold
Commodities / Gold and Silver 2021 Mar 10, 2021 - 05:58 PM GMTBy: Richard_Mills
Several factors influence gold prices (mainly the US dollar, gold ETF inflows/ outflows, inflation rate, bond yields, safe haven demand, physical gold demand, gold supply) but none is more reliable than real interest rates.
The demand for gold moves inversely to interest rates — the higher the rate of interest, the lower the demand for gold, the lower the rate of interest the higher the demand for gold.
The reason for this is simple, when real interest rates (interest rate minus inflation) are low, at, or below zero, cash and bonds fall out of favor because the real return is lower than inflation. If you are earning 1.6% on your money from a government bond, but inflation is running 2.7%, the real rate you are earning is negative 1.1% — an investor is actually losing purchasing power. Gold is the most proven investment to offer a return greater than inflation, by its rising price, or at least not a loss of purchasing power.
Bond market and gold market observers keep a close eye on US Treasury yields, particular the yield on the benchmark 10-year note. This is because the 10-year serves as a proxy for other financial products, such as mortgage rates, and it also signals investor confidence. When there is low confidence in the economy, people want safe investments, and US Treasuries are considered among the safest. Demand for Treasuries bids up their prices and yields fall. Conversely, when confidence returns, like is happening now, investors dump their bonds, thinking they do not need to play it safe. This causes bond prices to sink and yields to climb.
At AOTH we believe real interest rates are about to go negative; the 10-year Treasury yields 1.4% and the current rate of inflation is 1.4%, making real interest rates 0%.
Historically, we can see the inverse relationship between negative real interest rates and gold, by charting the gold price and the 10-year Treasury’s yield after inflation.
In an article titled ‘The Golden Dilemma’, authors Claude Erb and Campbell found a near-perfect negative correlation of -0.82 (-1 being a perfect negative correlation) between real interest rates and gold prices between 1997 and 2012. Going back further in history, when real interest rates turned negative during the second half of the 1970s, gold moved as high as $1,900 an ounce, as real rates plummeted as low as -6%. When Paul Volcker, Fed Chair under President Carter and Reagan, hiked short-term nominal interest rates, real rates returned to positive, ending gold’s run. In fact, the gold price continued to drift downward, reaching a 30-year low under $400 an ounce in 2001. The gold bull market of 2010 to 2013 is easily seen in juxtaposition with negative real interest rates which bottomed out at around -4% during that same period.
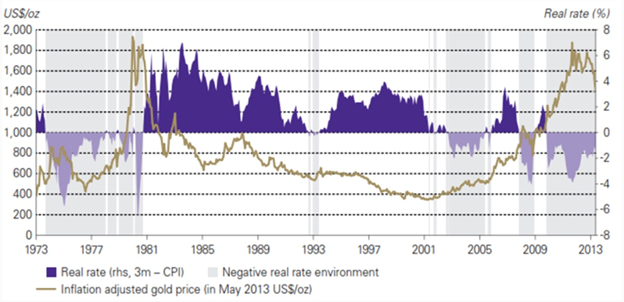
Historical real rate of inflation versus gold
In the FRED chart below, notice that the gold price between 2013 and 2020 never gets above $1,400, corresponding to the period when the real yield on the 10-year is between about 0% and 1%. However, when real yields “go negative,” as they did around 2011-13, and in 2020, gold prices jumped.
Last year’s 22% annual increase in the gold price was due to pandemic fears, combined with a low US dollar and plunging Treasury yields, causing real yields to go negative even though inflation stayed below 2%.
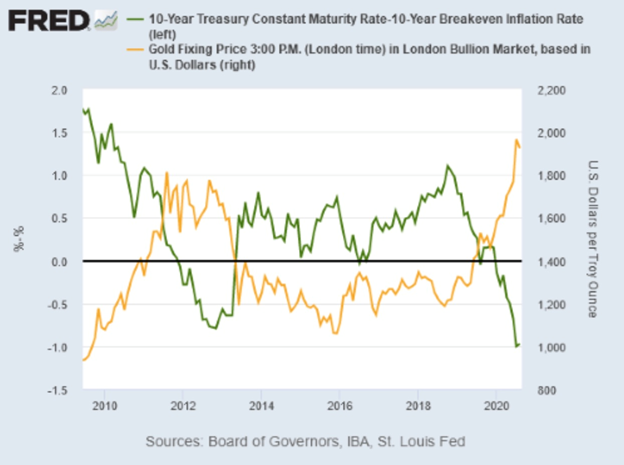
Gold prices jump when real yields “go negative,” as they did around 2011-13, and in 2020.
2020’s dramatic bond rally drove down yields across the world. On March 8, 2020, the US 10-year Treasury note reached an all-time low of -0.38%; two days earlier the German “bund” fell to a record -0.74%.
Investors piled into sovereign debt based on expectations of monetary stimulus like financial crisis-era easing programs that pushed down interest rates to zero and sparked a multi-year rally in stocks.
Commodities strong
This low interest rate/ bond yield environment combined with a sinking US dollar, have not only been good for gold, which rallied 22% last year, and silver which gained 46%, but the whole commodities complex.
Since interest rates were slashed last April, the prices of commodities have soared 45%, as measured by the Bloomberg Commodities index. Billionaire investor Stanley Druckenmiller, during a recent episode of Talks at GS, said that “the longer the Fed tries to keep rates suppressed… the more I win on my commodities.”
For instance, the price of copper has been rising along with a number of other metals including iron ore, zinc, and nickel, amid what some are calling a new commodities super-cycle.
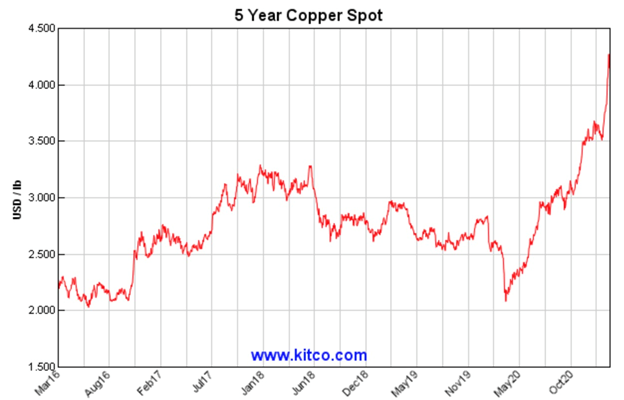
In 2003 the last commodities super-cycle was driven by growth in China, which demanded almost every commodity under the sun to meet double-digit annual increases to its GDP. This time is different. I believe we are going to see demand across the board for nearly every type of commodity, based on infrastructure renewal, electrification, reduction of carbon, and food demand.
And prices are likely to keep going up, as more liquidity is pumped into the economy by the US Federal Reserve.
Money-printing mayhem
Central bankers have realized that monetary policy, ie., keeping interest rates low and maintaining monthly asset purchases (ie. quantitative easing), has not given the desired economic boost; now they are counting on fiscal policy, ie., government spending, to do the trick. However, the US government does not have the money, so they borrow it, at rock-bottom interest rates.
A $2.26 trillion US deficit is predicted for 2021, not as high as 2020’s $3.3 trillion but more than double 2019’s $984 billion, and that is before the $1.9 trillion American Rescue Plan that President Biden is poised to enact. The covid-19 relief bill that is currently before Congress (we expect it will pass, the Dems plan to use “reconciliation” to get it through the deadlocked Senate on a simple majority), is on top of $900 billion in coronavirus aid passed in December by Trump.
Meanwhile Biden’s economic recovery package, expected to be unveiled this month, has as its centerpiece the biggest infrastructure spending commitments since Roosevelt’s New Deal. It includes roads, bridges and broadband internet access, with progressive Democrats eyeing much more, i.e., an expansion of Obamacare and a public sector jobs program.
When campaigning for president, Biden proposed $2 trillion for economic rebuilding, so we expect the infrastructure bill to contain at least that much, and probably more.
Then there is his Clean Energy Plan, another $2 trillion program to decarbonize US electricity in 15 years and create a net zero-emissions economy by 2050.
Drowning in debt
The US government has so far spent a jaw-dropping $4.5 trillion on pandemic-related relief, boosting the national debt to $28 trillion in under a year. In October, 2020, the debt zoomed past 100% of GDP, for the first time since the Second World War, but that was just the beginning. Based on monetary programs the Fed is already executing, the money supply will increase by another $2.3 trillion this year.
The US national debt could swell to nearly $30 trillion this year if Biden’s $1.9 trillion covid-19 relief package is approved by Congress, putting the government on a path to spend more money in one year than it borrowed to finance the Revolutionary War, the Civil War, the two World Wars, and the Cold War.
(Adding the $1.9T covid relief bill to the $4.5T already spent gives $6.4T, plus the $7T the Fed added to its balance sheet leaves roughly $14 trillion, or half the national debt. That is before Green New Deal spending, and promised social program spending by the Democrats, for example billions on health care and education, that remember, could easily be passed due to their majorities in Congress, and we could be looking at another $10-$14 trillion.)
We need to be very clear. This new spending, which would be unprecedented, is in addition to the loose monetary policy that is being followed by the Fed, meaning continued asset purchases to increase the money supply, and keeping interest rates close to zero. Thus, we have monetary easing happening at the same time as fiscal spending “carte blanche” (remember Biden believes strongly in the power of the state to tax and spend. A long wish list waits to be filled, with little to no concern regarding the already out of control $28 trillion national debt, courtesy of Modern Monetary Theory, or MMT.
Central banks are now caught in Sisyphean task of printing money to eternity. The more they print, the more they need to print…
On the one hand, the Fed can never voluntarily stop the printing as this would lead to instant collapse of stock markets, bond markets and the financial system. But on the other hand, the incessant printing also has consequences. It will destroy the dollar and it will destroy the treasury market and eventually lead to inflation and hyperinflation. Egon von Greyerz, Gold Switzerland
Inflation: already here and rising
The result of these two forces acting together, is bound to create inflation. We did not get inflation during the financial crisis because we didn’t have the spending component. This time is different.
We know that several commodities, from copper to crude oil, have been surging in price. The CRB Commodity Index is up 28% since last August.
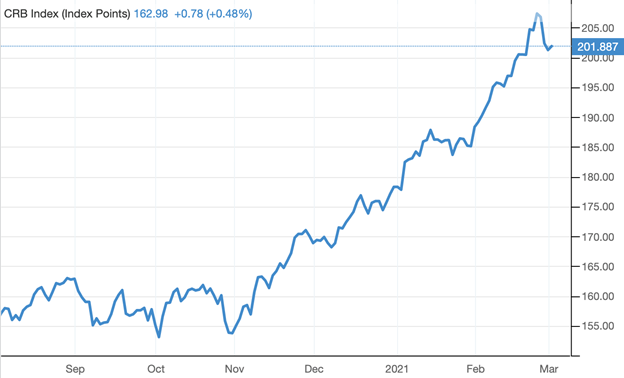
Source: Trading Economics
Disturbingly, food prices are rising higher than inflation and incomes in many parts of the world. In December, the Food and Agriculture Organization’s Food Price Index climbed for a seventh consecutive month. In Indonesia, tofu prices are 30% higher than in December, Brazilians are paying 30% more for turtle beans, and the price of sugar in Russia is up 61%.
In the US, where food security has become a serious issue, the latest figures from Feeding America show 13.2 million Americans face missing meals due to mass layoffs and depleted savings as they struggle to survive, reports Zero Hedge.
Meanwhile a global manufacturing surge is accelerating goods inflation, while the prices of services, many of which are down because of covid, remain in a slump. US prices of durable goods rose 3.5% in January compared to only a 1.3% increase for services. According to the Institute of Supply Management, via Reuters, last month saw one of the most widespread improvements in business conditions in 30 years, with the composite purchasing managers’ rising to 60.8 in February, the highest level since February 2018 and before that May, 2004.
Brazil’s monthly producer price inflation rose 3.3% in January, the second highest since 2014. Prices across all 24 activities surveyed were up. With consumer price expectations moving beyond the 3.75% target set by Brazil’s central bank, economists think the bank will raise interest rates next month.
Consider too: the primary risk to an extraordinary expansion of the money supply is inflation. Just ask the Fed officials who tried, and failed, to control inflation through monetary expansion during the hyperinflationary 1970s.
So far, the Fed’s creation of money literally “out of thin air” has added about $7 trillion to its balance sheet since covid-19 hit.
Simply put, the more money that is created, the less valuable the rest of the money becomes. Therefore inflation erodes the value of currencies.
Falling buck
Even with low inflation, the dollar is down against nearly every major currency over the past six months.

U.S. Dollar Index (DXY), Source: MarketWatch
It looks as though the only direction that the greenback is headed is down, thanks to the Federal Reserve’s accommodation of low interest rates and higher inflation.
Many believe that the dollar, which fell to a 2.5-year low last year, will continue to face downward pressure in 2021 regardless of how the covid situation unfolds.
Alex Kimani, writing for Safe Haven, goes further than that, stating that the buck could stay low for years, based on three factors: a strong euro, a dovish Fed, and more government stimulus.
Economist Stephen Roach stirred up controversy last summer when he predicted the USD will plummet 35% by the end of 2021. In an end of January column in Bloomberg, Roach re-affirmed his belief in a sinking dollar, arguing it will continue to lose value based on a widening US current account deficit, a stronger euro, and the Fed, which will do little to prop up any USD weakness.
CNBC adds that the dollar is also likely to fall due to geopolitical risks being lower with Biden as president, and the fact that US trade policy will probably become more predictable, without escalating tariff threats. (investors tend to move their funds into US dollars, or USD-denominated assets like Treasuries, in the event of destabilizing events like trade wars, civil unrest or military confrontations)
Buy the dip
Given, therefore, the likelihood of a weak US dollar, higher inflation, owing to massive government stimulus and continued quantitative easing from the Fed and other central banks, and interest rates likely to stay low for the next couple of years (notwithstanding what is happening with Treasury yields), we think there is a strong case for taking a position in gold right now.
More so considering that gold and gold juniors, which offer the best leverage to rising metals prices, are on sale.
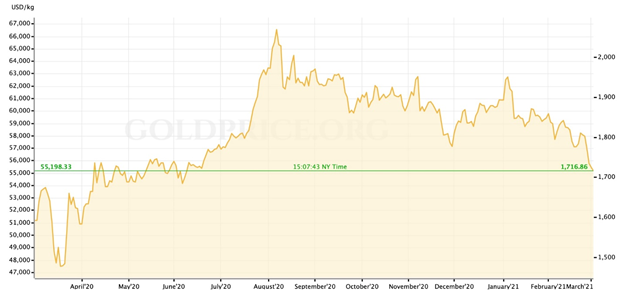
We can not argue that gold is taking it on the chin due to rising bond yields. Last week, bullion fell to an 8-month low as the 10-year hit 1.6%.
Source: Goldprice.org
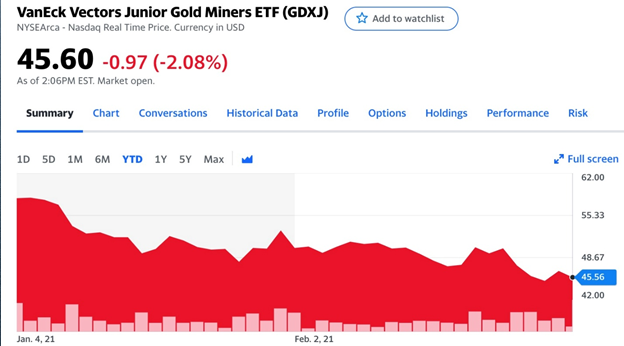
The VanEck Vectors Junior Gold Miners ETF (GDXJ), considered a proxy for gold juniors, has had a rough year, posting a 27% loss. It is no better for the producers. After a great run last year, the VanEck Vectors Gold Miners ETF (GDX), is down nearly 23%, year to date.
Source: Yahoo Finance
Gold investors left holding the bag from last summer’s gains are probably not too happy right now. Some may be considering selling, or have already sold, and are now looking at putting their freed-up cash into the bond market, where prices are cheap and yields are rising.
As the old trading adage goes, the time to buy is when there’s blood in the streets. In my opinion that does not mean bonds this time around, but gold.
Locking your money away for a decade in a 10-year Treasury note does not make any sense when the yield is 1.4% and inflation is running at 1.4% (and we suspect heading much higher), wiping out your income.
Same goes for savings accounts. Americans are reportedly squirreling away their money like never before, thanks to $1,200 stimulus checks and other covid relief programs. At the end of 2020, US banks held a record $17.8 trillion in deposits, which put pressure on savings account yields. In February, the average interest rate for a personal savings account fell to 0.49%, a new all-time low. This, of course, does not come close to matching the rate of inflation. At such pitiful interest rates, savers are literally losing money every day they leave their money in the bank.
Saving during the pandemic is a trend that is happening beyond the United States. According to estimates by Bloomberg Economics, consumers in the world’s largest economies amassed $2.9 trillion in extra savings during covid-related lockdowns — with half of that total, $1.5 trillion, in the US alone. Bloomberg notes that is at least double the average annual growth of gross domestic product seen during the last expansion, and equivalent to the annual output of South Korea.
Moreover, this amount of hoarded cash creates the potential for a powerful economic recovery, however, only if that money is spent rather than saved:
The optimists are betting on a shopping spree as people return to retailers, restaurants, entertainment venues, tourist hot spots and sports events as well as accelerate those big-ticket purchases they held back on. Those who are less confident wonder if the money will instead be used to cover debts or hoarded until the health crisis passes and labor markets look stronger. In the U.S., a running down of all the money saved in the past year would propel economic growth to as much as 9% rather than the 4.6% currently projected for 2021 GDP, according to BE. By contrast, if the savings go unspent, the economy will likely grow just 2.2%.
All of that pent-up capital is highly positive for economic growth going forward, although there is also the risk of it fueling inflation. Fed Chairman Jerome Powell has already said the Fed plans to let inflation run a little hot so as to meet a long-term average of 2%. How much higher remains to be seen but there is certainly the potential for it getting out of control.
Conclusion
Higher inflation is good for gold especially if Treasury yields don’t get too high, a situation that would give negative real interest rates. Historical charts prove that every time yields fall below the rate of inflation, ie. they turn negative, gold goes up.
Apart from negative real rates, gold is also, we believe, destined for the next leg up once investors realize the US dollar is being massively devalued.
Consider: gold prices move higher when the dollar drops. Right now, the US dollar index DXY is holding around 90, but what happens when people realize the federal government has depreciated the greenback by spending $6.5 trillion using borrowed money, plus the Fed’s $7 trillion, meaning the purchasing power of the dollar has been cut in half? The equivalent of half the $28-trillion national debt? And with trillions more of debt to come, at AOTH we believe there is only one way for the dollar.
When debt piles up and inflation moves higher, the smart money will flow into gold and silver juniors, especially those with deposits likely to be of interest to major mining companies or financing partners.
We don’t know when this will happen, but we are confident it will. At AOTH we see precious metals as the right play for investors who are looking beyond the headlines and willing to go against the herd and shoulder some risk.
That is what being an ahead of the herd contrarian investor is all about. We see gold’s dip as temporary and we are hanging onto our gold juniors and averaging down, while share prices are low.
It is not a matter of if, but when, precious metals regain their lustre.
By Richard (Rick) Mills
If you're interested in learning more about the junior resource and bio-med sectors please come and visit us at www.aheadoftheherd.com Site membership is free. No credit card or personal information is asked for.
Richard is host of Aheadoftheherd.com and invests in the junior resource sector. His articles have been published on over 400 websites, including: Wall Street Journal, Market Oracle, USAToday, National Post, Stockhouse, Lewrockwell, Pinnacledigest, Uranium Miner, Beforeitsnews, SeekingAlpha, MontrealGazette, Casey Research, 24hgold, Vancouver Sun, CBSnews, SilverBearCafe, Infomine, Huffington Post, Mineweb, 321Gold, Kitco, Gold-Eagle, The Gold/Energy Reports, Calgary Herald, Resource Investor, Mining.com, Forbes, FNArena, Uraniumseek, Financial Sense, Goldseek, Dallasnews, Vantagewire, Resourceclips and the Association of Mining Analysts.
Copyright © 2021 Richard (Rick) Mills - All Rights Reserved
Legal Notice / Disclaimer: This document is not and should not be construed as an offer to sell or the solicitation of an offer to purchase or subscribe for any investment. Richard Mills has based this document on information obtained from sources he believes to be reliable but which has not been independently verified; Richard Mills makes no guarantee, representation or warranty and accepts no responsibility or liability as to its accuracy or completeness. Expressions of opinion are those of Richard Mills only and are subject to change without notice. Richard Mills assumes no warranty, liability or guarantee for the current relevance, correctness or completeness of any information provided within this Report and will not be held liable for the consequence of reliance upon any opinion or statement contained herein or any omission. Furthermore, I, Richard Mills, assume no liability for any direct or indirect loss or damage or, in particular, for lost profit, which you may incur as a result of the use and existence of the information provided within this Report.
© 2005-2022 http://www.MarketOracle.co.uk - The Market Oracle is a FREE Daily Financial Markets Analysis & Forecasting online publication.


