How NOT to Be Among the MANY Stock Investors Fooled by This Market Myth
Stock-Markets / Oil Companies Nov 15, 2018 - 04:05 PM GMTBy: EWI
October included a market phenomenon that left many economists and commentators scratching their heads.
US stocks and oil prices both dropped simultaneously. In fact, it was the worst month for oil in 2 years and the worst month for S&P 500 in over 7 years.
What was the "phenomenon"? Well, conventional wisdom says that rising oil prices are bearish for stocks. So, how could falling oil prices also be bearish for stocks?
In Chapter 2 of his seminal book, The Socionomic Theory of Finance, Robert Prechter covers 13 erroneous market correlations that most investor believe, but in fact are bogus. Armed with dozens of historical studies, Prechter scrutinizes the evidence regarding each claim. Here's what he writes about the supposed correlation between oil and stock prices.
(Note: If you haven't read The Socionomic Theory of Finance, you should. You'd be shocked how much of what you are fed is bogus. Learn more about the book, including how you can get it for free here.)
---
Excerpted from The Socionomic Theory of Finance by Robert Prechter
Claim #2: "rising oil prices are bearish for stocks."
It would take months to collect all the statements that economists have made to the press over the past forty years to the effect that rising oil prices are "a concern" or that an unexpected (they're always unexpected) "oil price shock" would force them to adjust or rescind their bullish outlook for stocks and the economy. Academic papers supporting this claim are legion.
For many economists, the underlying assumption about causality in this case stems from the experience of 1973-1974 after the Arab Oil Embargo, when stock prices went down as oil prices went up. That juxtaposition appeared to fit a sensible story of causation regarding oil prices and stock prices, to wit: Rising oil prices increase the cost of energy and therefore reduce corporate profits and consumers' spending power, thus putting drags on stock prices and the economy.
These headlines are compatible with this claim:
Earnings, Lower Oil Prices Rally Stocks—USA Today, April 8, 2006
Surging Oil Prices Pull Stocks Lower—ABC News, July 14, 2006
Is the claim valid?

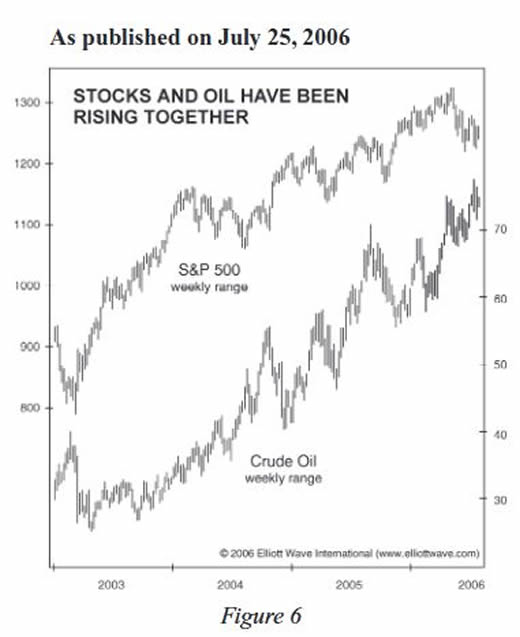
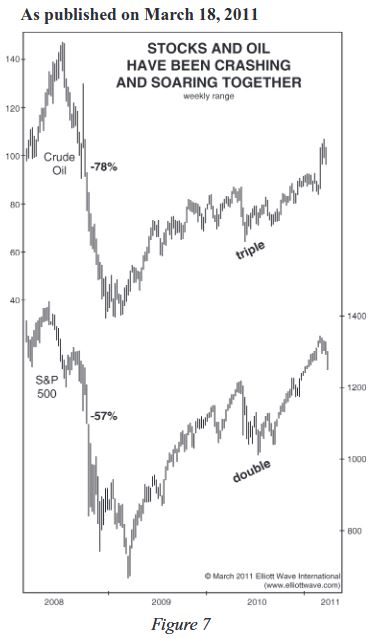
In response to these very headlines, the July 25, 2006 issue of The Elliott Wave Theorist offered Figure 6, showing the preceding three-year market environment. Examine it and see if you can discern any indication whatsoever that lower oil prices make stocks rise or vice versa. As I said at the time, "Oil and stocks have trended mostly in the same direction for more than three years, so these headlines are backwards." Switching to forecasting mode, that issue added, "A falling oil price probably won't be bullish for stocks, either. When deflation takes hold, they will probably both go down together." That's exactly what happened two years later, as you can see on the left-hand side of Figure 7.

One of the most revealing headlines of this period occurred a month into oil's crash:
It's hard to lose betting on stocks as oil falls
—USA Today,
August 12, 2008
The accompanying article offered a 20-year study that predicted how much each stock sector would rise during a bear market in oil. An economist and chief portfolio manager explained, "If oil prices are falling, a key cost for both consumers and businesses is also falling. It acts as a benefit for the stock market overall." A fellow money manager agreed, saying, "Nothing bad happens if oil prices keep falling. But if oil prices turn up, uh oh."1 The causal case could hardly have been clearer. As it turns out, the very next trading day capped a three-week stock market rally, after which the Dow began to accelerate downward in its biggest bear market in three generations, all while plunging oil prices were providing their supposed benefit to consumers, businesses and the stock market.
On February 21, 2011, the price of oil rose for a day (ostensibly on unrest in the Middle East), and U.S. stocks fell. The media once again quoted many economists warning that an "oil-price shock" would be bearish for stocks and the economy. At least three world-class news publications 2 ran lead editorials detailing the financial and economic damage said oil price shock might cause. Those assertions prompted our publication of Figure 7. Observe that as oil prices crashed 78% in five months, stock prices were cut in half; and then, as oil tripled, stocks doubled. These are not minor moves that one could dismiss as being anomalous. They include the biggest, fastest decline in oil prices ever along with the deepest stock market decline in 76 years, and the fastest oil-price-tripling on record along with the fastest two-year stock market rise in 72 years. Consider also that during most of the decline in both markets a recession was in progress, and during most of the rise in both markets an economic recovery was in progress. These are palpable refutations of economists' causal hypothesis.
No one looking at these histories could wrest from them the idea that rising oil prices "shock" the stock market into a decline and the economy into a contraction and vice versa. Only those not looking at data who are married to their causal explanation and who routinely ignore evidence could tell reporters in February 2011 that a one-day rise in the oil price was bearish for stocks and that further rises in its price would wreak havoc on the stock market and the economy. Yet dozens of experts did just that, in dozens of articles.
As with our interest-rates example, an economist could account for the evidence in Figure 7 and stay true to his exogenous-cause model by reversing the direction of his exogenous-cause argument—as we did earlier with respect to the stock market and interest rates—to postulate that an expanding economy makes stock prices and oil prices rise and fall together. He could offer the following logic: As the economy expands, business picks up, so stock prices rise; and as businesses operate at higher capacity, demand for energy rises, pushing up the price of oil. That's why prices for stocks and oil go up together. That makes sense, too, doesn't it?
An economist who made that case, however, would have to tell the media that the one-day rise in the oil price was bullish and that a falling oil price would jeopardize the stock market and the economy. Would economists ever say such a thing?
---
In the rest of this chapter, Prechter investigates the correlations between stock prices and interest rates, corporate earnings, employment … and much, much more. It's an essential read for serious investors. Learn more here.
This article was syndicated by Elliott Wave International and was originally published under the headline . EWI is the world's largest market forecasting firm. Its staff of full-time analysts led by Chartered Market Technician Robert Prechter provides 24-hour-a-day market analysis to institutional and private investors around the world.
© 2005-2022 http://www.MarketOracle.co.uk - The Market Oracle is a FREE Daily Financial Markets Analysis & Forecasting online publication.


